Aleut vs Immigrants from Colombia Master's Degree
COMPARE
Aleut
Immigrants from Colombia
Master's Degree
Master's Degree Comparison
Aleuts
Immigrants from Colombia
11.8%
MASTER'S DEGREE
0.1/ 100
METRIC RATING
286th/ 347
METRIC RANK
14.9%
MASTER'S DEGREE
48.3/ 100
METRIC RATING
177th/ 347
METRIC RANK
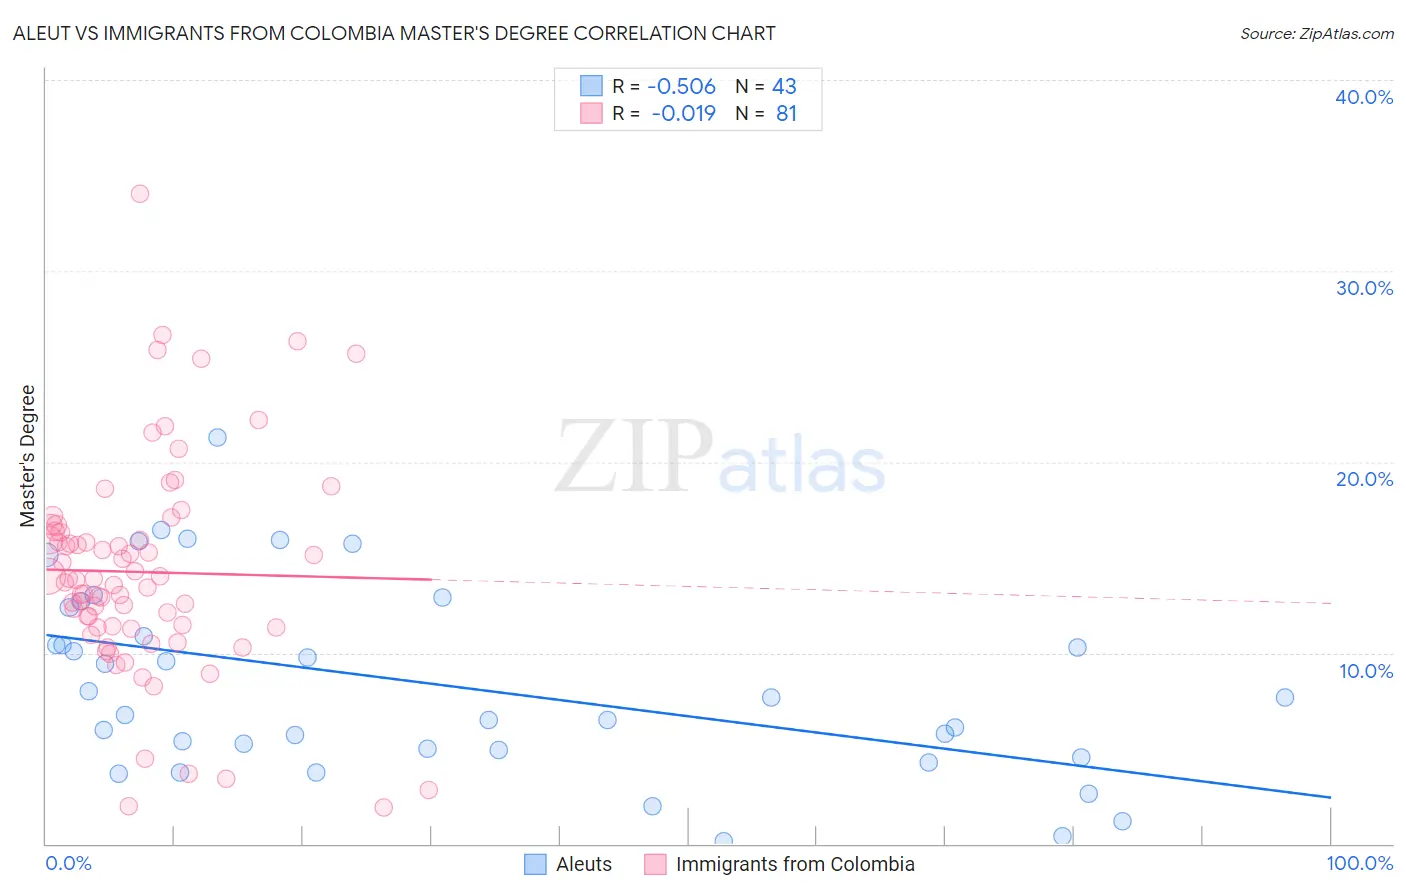
Aleut vs Immigrants from Colombia Master's Degree Correlation Chart
The statistical analysis conducted on geographies consisting of 61,771,787 people shows a substantial negative correlation between the proportion of Aleuts and percentage of population with at least master's degree education in the United States with a correlation coefficient (R) of -0.506 and weighted average of 11.8%. Similarly, the statistical analysis conducted on geographies consisting of 378,578,411 people shows no correlation between the proportion of Immigrants from Colombia and percentage of population with at least master's degree education in the United States with a correlation coefficient (R) of -0.019 and weighted average of 14.9%, a difference of 26.2%.
Master's Degree Correlation Summary
| Measurement | Aleut | Immigrants from Colombia |
| Minimum | 0.13% | 1.9% |
| Maximum | 21.3% | 34.0% |
| Range | 21.2% | 32.1% |
| Mean | 8.4% | 14.2% |
| Median | 7.7% | 13.8% |
| Interquartile 25% (IQ1) | 4.9% | 11.3% |
| Interquartile 75% (IQ3) | 12.4% | 16.3% |
| Interquartile Range (IQR) | 7.5% | 5.0% |
| Standard Deviation (Sample) | 5.0% | 5.6% |
| Standard Deviation (Population) | 4.9% | 5.6% |
Similar Demographics by Master's Degree
Demographics Similar to Aleuts by Master's Degree
In terms of master's degree, the demographic groups most similar to Aleuts are Immigrants from Haiti (11.8%, a difference of 0.20%), Immigrants from Nicaragua (11.8%, a difference of 0.35%), Immigrants from Honduras (11.8%, a difference of 0.36%), Guatemalan (11.7%, a difference of 0.44%), and Ottawa (11.9%, a difference of 0.54%).
| Demographics | Rating | Rank | Master's Degree |
| Immigrants | Belize | 0.2 /100 | #279 | Tragic 12.1% |
| Immigrants | Dominican Republic | 0.2 /100 | #280 | Tragic 12.1% |
| Malaysians | 0.2 /100 | #281 | Tragic 12.0% |
| Immigrants | El Salvador | 0.2 /100 | #282 | Tragic 12.0% |
| Hondurans | 0.2 /100 | #283 | Tragic 11.9% |
| Ottawa | 0.2 /100 | #284 | Tragic 11.9% |
| Immigrants | Nicaragua | 0.2 /100 | #285 | Tragic 11.8% |
| Aleuts | 0.1 /100 | #286 | Tragic 11.8% |
| Immigrants | Haiti | 0.1 /100 | #287 | Tragic 11.8% |
| Immigrants | Honduras | 0.1 /100 | #288 | Tragic 11.8% |
| Guatemalans | 0.1 /100 | #289 | Tragic 11.7% |
| Ute | 0.1 /100 | #290 | Tragic 11.7% |
| Colville | 0.1 /100 | #291 | Tragic 11.6% |
| Immigrants | Guatemala | 0.1 /100 | #292 | Tragic 11.6% |
| Alaska Natives | 0.1 /100 | #293 | Tragic 11.6% |
Demographics Similar to Immigrants from Colombia by Master's Degree
In terms of master's degree, the demographic groups most similar to Immigrants from Colombia are Nigerian (14.9%, a difference of 0.030%), Immigrants from Peru (14.9%, a difference of 0.17%), Slovak (14.9%, a difference of 0.21%), English (14.8%, a difference of 0.44%), and Costa Rican (15.0%, a difference of 0.53%).
| Demographics | Rating | Rank | Master's Degree |
| Irish | 56.3 /100 | #170 | Average 15.0% |
| Immigrants | Ghana | 53.6 /100 | #171 | Average 15.0% |
| Immigrants | Uruguay | 52.8 /100 | #172 | Average 15.0% |
| Costa Ricans | 52.5 /100 | #173 | Average 15.0% |
| Slovaks | 50.0 /100 | #174 | Average 14.9% |
| Immigrants | Peru | 49.6 /100 | #175 | Average 14.9% |
| Nigerians | 48.6 /100 | #176 | Average 14.9% |
| Immigrants | Colombia | 48.3 /100 | #177 | Average 14.9% |
| English | 45.0 /100 | #178 | Average 14.8% |
| Immigrants | Iraq | 41.3 /100 | #179 | Average 14.8% |
| Celtics | 41.3 /100 | #180 | Average 14.8% |
| Swiss | 41.1 /100 | #181 | Average 14.7% |
| Czechs | 40.4 /100 | #182 | Average 14.7% |
| Sri Lankans | 39.6 /100 | #183 | Fair 14.7% |
| Immigrants | Zaire | 39.5 /100 | #184 | Fair 14.7% |