Burmese vs Immigrants from Haiti Median Female Earnings
COMPARE
Burmese
Immigrants from Haiti
Median Female Earnings
Median Female Earnings Comparison
Burmese
Immigrants from Haiti
$44,911
MEDIAN FEMALE EARNINGS
100.0/ 100
METRIC RATING
23rd/ 347
METRIC RANK
$36,203
MEDIAN FEMALE EARNINGS
0.1/ 100
METRIC RATING
283rd/ 347
METRIC RANK
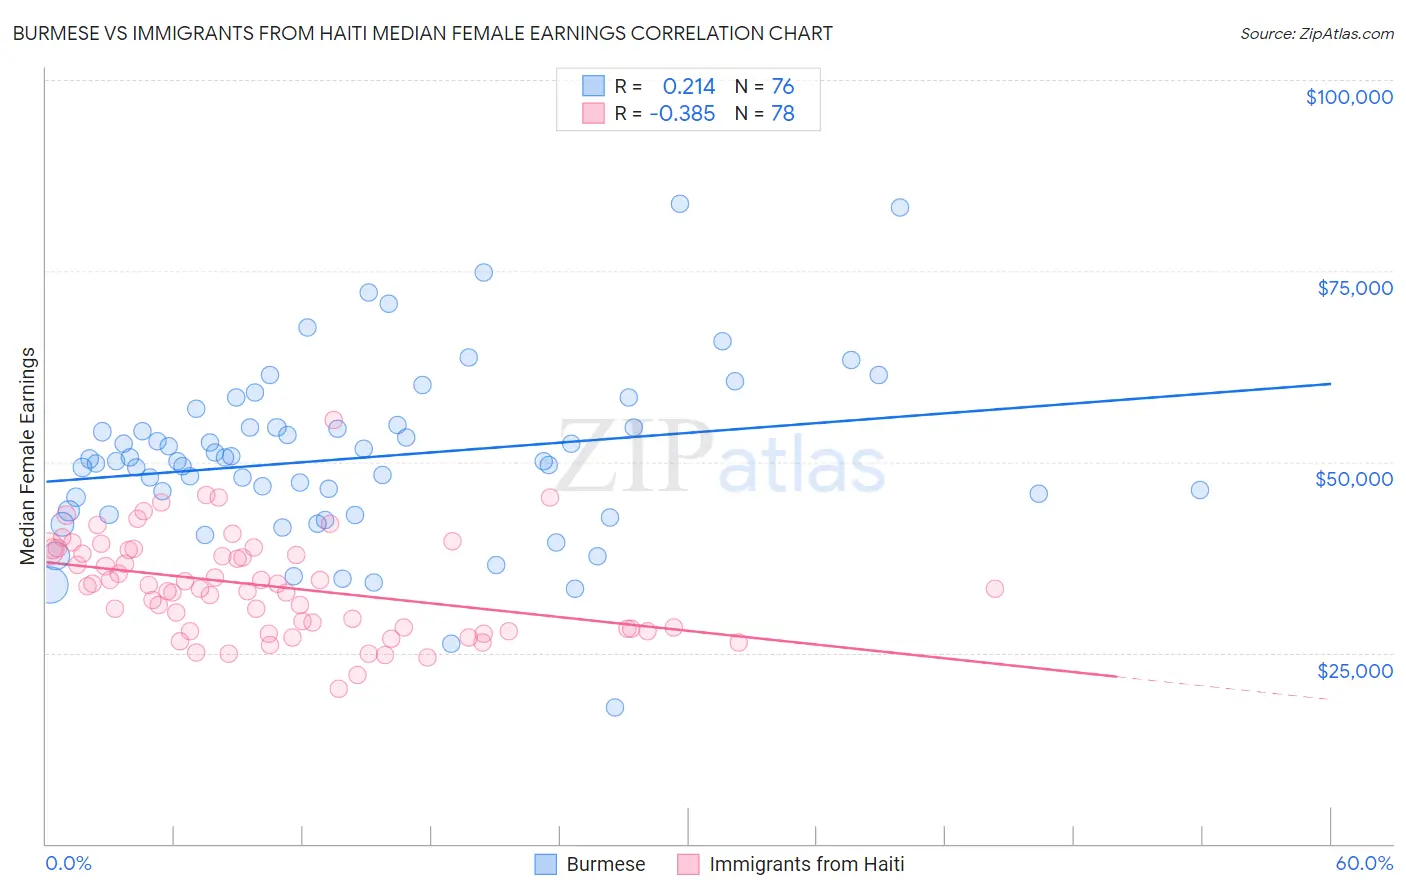
Burmese vs Immigrants from Haiti Median Female Earnings Correlation Chart
The statistical analysis conducted on geographies consisting of 465,115,174 people shows a weak positive correlation between the proportion of Burmese and median female earnings in the United States with a correlation coefficient (R) of 0.214 and weighted average of $44,911. Similarly, the statistical analysis conducted on geographies consisting of 225,248,114 people shows a mild negative correlation between the proportion of Immigrants from Haiti and median female earnings in the United States with a correlation coefficient (R) of -0.385 and weighted average of $36,203, a difference of 24.0%.
Median Female Earnings Correlation Summary
| Measurement | Burmese | Immigrants from Haiti |
| Minimum | $17,769 | $20,229 |
| Maximum | $83,750 | $55,536 |
| Range | $65,981 | $35,307 |
| Mean | $50,485 | $33,736 |
| Median | $50,131 | $33,585 |
| Interquartile 25% (IQ1) | $43,337 | $28,139 |
| Interquartile 75% (IQ3) | $54,499 | $38,581 |
| Interquartile Range (IQR) | $11,162 | $10,442 |
| Standard Deviation (Sample) | $11,391 | $6,572 |
| Standard Deviation (Population) | $11,316 | $6,529 |
Similar Demographics by Median Female Earnings
Demographics Similar to Burmese by Median Female Earnings
In terms of median female earnings, the demographic groups most similar to Burmese are Immigrants from Greece ($44,976, a difference of 0.14%), Immigrants from Korea ($44,847, a difference of 0.14%), Cambodian ($45,014, a difference of 0.23%), Immigrants from Sweden ($44,774, a difference of 0.31%), and Immigrants from Belarus ($44,757, a difference of 0.34%).
| Demographics | Rating | Rank | Median Female Earnings |
| Indians (Asian) | 100.0 /100 | #16 | Exceptional $46,481 |
| Immigrants | South Central Asia | 100.0 /100 | #17 | Exceptional $46,324 |
| Cypriots | 100.0 /100 | #18 | Exceptional $45,570 |
| Eastern Europeans | 100.0 /100 | #19 | Exceptional $45,385 |
| Immigrants | Japan | 100.0 /100 | #20 | Exceptional $45,323 |
| Cambodians | 100.0 /100 | #21 | Exceptional $45,014 |
| Immigrants | Greece | 100.0 /100 | #22 | Exceptional $44,976 |
| Burmese | 100.0 /100 | #23 | Exceptional $44,911 |
| Immigrants | Korea | 100.0 /100 | #24 | Exceptional $44,847 |
| Immigrants | Sweden | 100.0 /100 | #25 | Exceptional $44,774 |
| Immigrants | Belarus | 100.0 /100 | #26 | Exceptional $44,757 |
| Turks | 100.0 /100 | #27 | Exceptional $44,695 |
| Immigrants | Russia | 100.0 /100 | #28 | Exceptional $44,680 |
| Immigrants | Belgium | 100.0 /100 | #29 | Exceptional $44,587 |
| Asians | 100.0 /100 | #30 | Exceptional $44,586 |
Demographics Similar to Immigrants from Haiti by Median Female Earnings
In terms of median female earnings, the demographic groups most similar to Immigrants from Haiti are Indonesian ($36,140, a difference of 0.17%), Paiute ($36,056, a difference of 0.41%), Haitian ($36,374, a difference of 0.47%), Osage ($36,034, a difference of 0.47%), and Immigrants from Nicaragua ($36,023, a difference of 0.50%).
| Demographics | Rating | Rank | Median Female Earnings |
| Central Americans | 0.1 /100 | #276 | Tragic $36,492 |
| Marshallese | 0.1 /100 | #277 | Tragic $36,459 |
| U.S. Virgin Islanders | 0.1 /100 | #278 | Tragic $36,424 |
| Immigrants | Caribbean | 0.1 /100 | #279 | Tragic $36,414 |
| Iroquois | 0.1 /100 | #280 | Tragic $36,408 |
| Spanish Americans | 0.1 /100 | #281 | Tragic $36,391 |
| Haitians | 0.1 /100 | #282 | Tragic $36,374 |
| Immigrants | Haiti | 0.1 /100 | #283 | Tragic $36,203 |
| Indonesians | 0.1 /100 | #284 | Tragic $36,140 |
| Paiute | 0.1 /100 | #285 | Tragic $36,056 |
| Osage | 0.0 /100 | #286 | Tragic $36,034 |
| Immigrants | Nicaragua | 0.0 /100 | #287 | Tragic $36,023 |
| Immigrants | Zaire | 0.0 /100 | #288 | Tragic $36,017 |
| Bangladeshis | 0.0 /100 | #289 | Tragic $35,960 |
| Central American Indians | 0.0 /100 | #290 | Tragic $35,930 |