Immigrants from Eritrea vs Immigrants from Haiti Median Female Earnings
COMPARE
Immigrants from Eritrea
Immigrants from Haiti
Median Female Earnings
Median Female Earnings Comparison
Immigrants from Eritrea
Immigrants from Haiti
$41,485
MEDIAN FEMALE EARNINGS
97.6/ 100
METRIC RATING
106th/ 347
METRIC RANK
$36,203
MEDIAN FEMALE EARNINGS
0.1/ 100
METRIC RATING
283rd/ 347
METRIC RANK
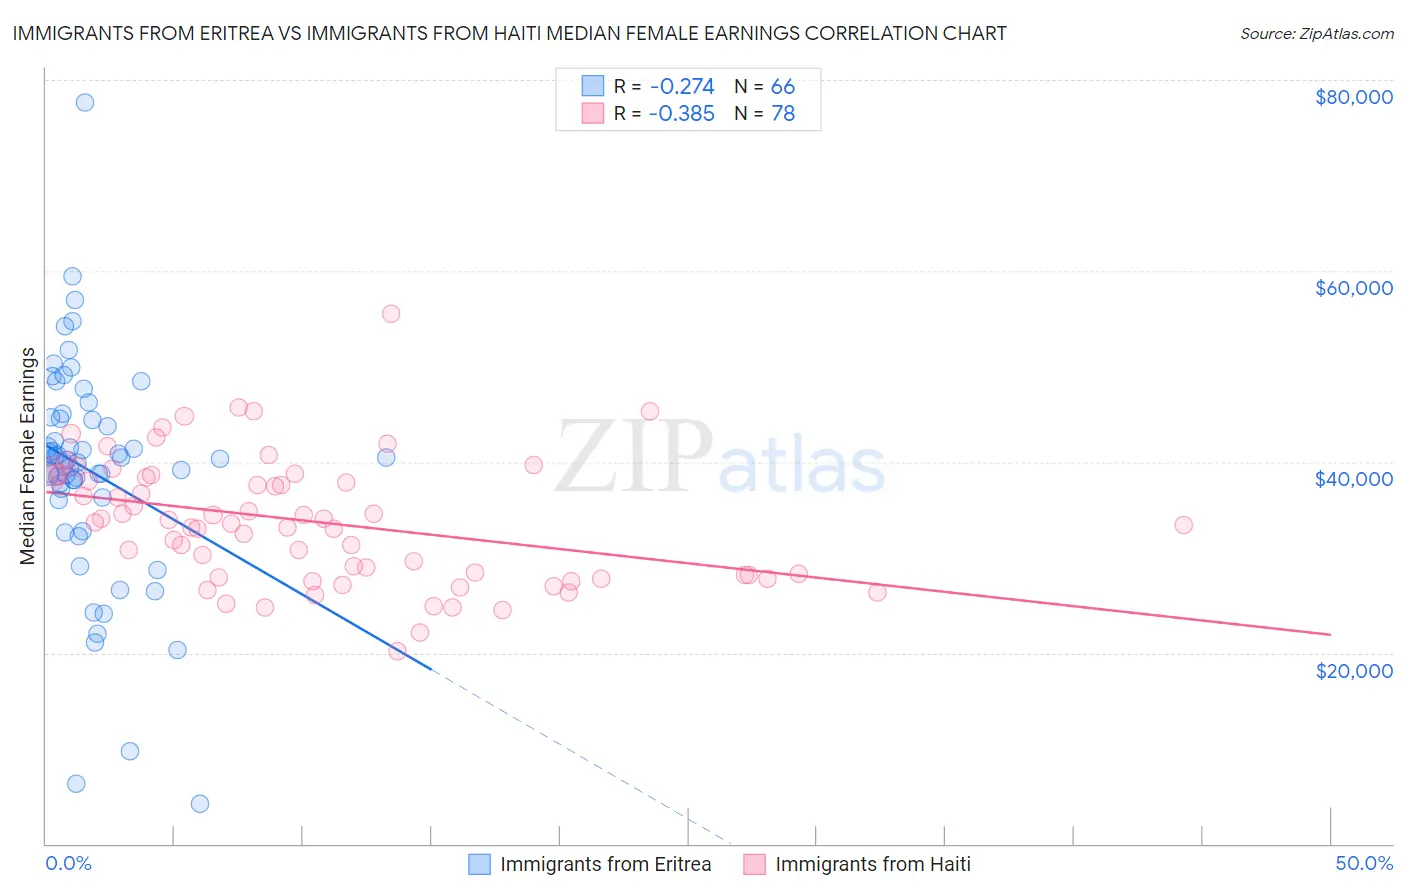
Immigrants from Eritrea vs Immigrants from Haiti Median Female Earnings Correlation Chart
The statistical analysis conducted on geographies consisting of 104,836,938 people shows a weak negative correlation between the proportion of Immigrants from Eritrea and median female earnings in the United States with a correlation coefficient (R) of -0.274 and weighted average of $41,485. Similarly, the statistical analysis conducted on geographies consisting of 225,248,114 people shows a mild negative correlation between the proportion of Immigrants from Haiti and median female earnings in the United States with a correlation coefficient (R) of -0.385 and weighted average of $36,203, a difference of 14.6%.
Median Female Earnings Correlation Summary
| Measurement | Immigrants from Eritrea | Immigrants from Haiti |
| Minimum | $4,132 | $20,229 |
| Maximum | $77,694 | $55,536 |
| Range | $73,562 | $35,307 |
| Mean | $38,981 | $33,736 |
| Median | $40,245 | $33,585 |
| Interquartile 25% (IQ1) | $36,285 | $28,139 |
| Interquartile 75% (IQ3) | $44,525 | $38,581 |
| Interquartile Range (IQR) | $8,239 | $10,442 |
| Standard Deviation (Sample) | $11,801 | $6,572 |
| Standard Deviation (Population) | $11,712 | $6,529 |
Similar Demographics by Median Female Earnings
Demographics Similar to Immigrants from Eritrea by Median Female Earnings
In terms of median female earnings, the demographic groups most similar to Immigrants from Eritrea are Palestinian ($41,484, a difference of 0.0%), Italian ($41,505, a difference of 0.050%), Jordanian ($41,464, a difference of 0.050%), Chinese ($41,461, a difference of 0.060%), and Immigrants from Zimbabwe ($41,527, a difference of 0.10%).
| Demographics | Rating | Rank | Median Female Earnings |
| Immigrants | Barbados | 98.4 /100 | #99 | Exceptional $41,685 |
| Romanians | 98.3 /100 | #100 | Exceptional $41,663 |
| Immigrants | Fiji | 98.3 /100 | #101 | Exceptional $41,656 |
| Immigrants | Poland | 98.2 /100 | #102 | Exceptional $41,630 |
| Immigrants | Argentina | 97.9 /100 | #103 | Exceptional $41,554 |
| Immigrants | Zimbabwe | 97.8 /100 | #104 | Exceptional $41,527 |
| Italians | 97.7 /100 | #105 | Exceptional $41,505 |
| Immigrants | Eritrea | 97.6 /100 | #106 | Exceptional $41,485 |
| Palestinians | 97.6 /100 | #107 | Exceptional $41,484 |
| Jordanians | 97.5 /100 | #108 | Exceptional $41,464 |
| Chinese | 97.5 /100 | #109 | Exceptional $41,461 |
| Immigrants | Western Asia | 97.0 /100 | #110 | Exceptional $41,375 |
| Immigrants | Canada | 97.0 /100 | #111 | Exceptional $41,373 |
| Immigrants | North America | 96.7 /100 | #112 | Exceptional $41,319 |
| Macedonians | 96.4 /100 | #113 | Exceptional $41,286 |
Demographics Similar to Immigrants from Haiti by Median Female Earnings
In terms of median female earnings, the demographic groups most similar to Immigrants from Haiti are Indonesian ($36,140, a difference of 0.17%), Paiute ($36,056, a difference of 0.41%), Haitian ($36,374, a difference of 0.47%), Osage ($36,034, a difference of 0.47%), and Immigrants from Nicaragua ($36,023, a difference of 0.50%).
| Demographics | Rating | Rank | Median Female Earnings |
| Central Americans | 0.1 /100 | #276 | Tragic $36,492 |
| Marshallese | 0.1 /100 | #277 | Tragic $36,459 |
| U.S. Virgin Islanders | 0.1 /100 | #278 | Tragic $36,424 |
| Immigrants | Caribbean | 0.1 /100 | #279 | Tragic $36,414 |
| Iroquois | 0.1 /100 | #280 | Tragic $36,408 |
| Spanish Americans | 0.1 /100 | #281 | Tragic $36,391 |
| Haitians | 0.1 /100 | #282 | Tragic $36,374 |
| Immigrants | Haiti | 0.1 /100 | #283 | Tragic $36,203 |
| Indonesians | 0.1 /100 | #284 | Tragic $36,140 |
| Paiute | 0.1 /100 | #285 | Tragic $36,056 |
| Osage | 0.0 /100 | #286 | Tragic $36,034 |
| Immigrants | Nicaragua | 0.0 /100 | #287 | Tragic $36,023 |
| Immigrants | Zaire | 0.0 /100 | #288 | Tragic $36,017 |
| Bangladeshis | 0.0 /100 | #289 | Tragic $35,960 |
| Central American Indians | 0.0 /100 | #290 | Tragic $35,930 |