Alaskan Athabascan vs New Zealander Per Capita Income
COMPARE
Alaskan Athabascan
New Zealander
Per Capita Income
Per Capita Income Comparison
Alaskan Athabascans
New Zealanders
$39,163
PER CAPITA INCOME
0.6/ 100
METRIC RATING
260th/ 347
METRIC RANK
$50,575
PER CAPITA INCOME
100.0/ 100
METRIC RATING
49th/ 347
METRIC RANK
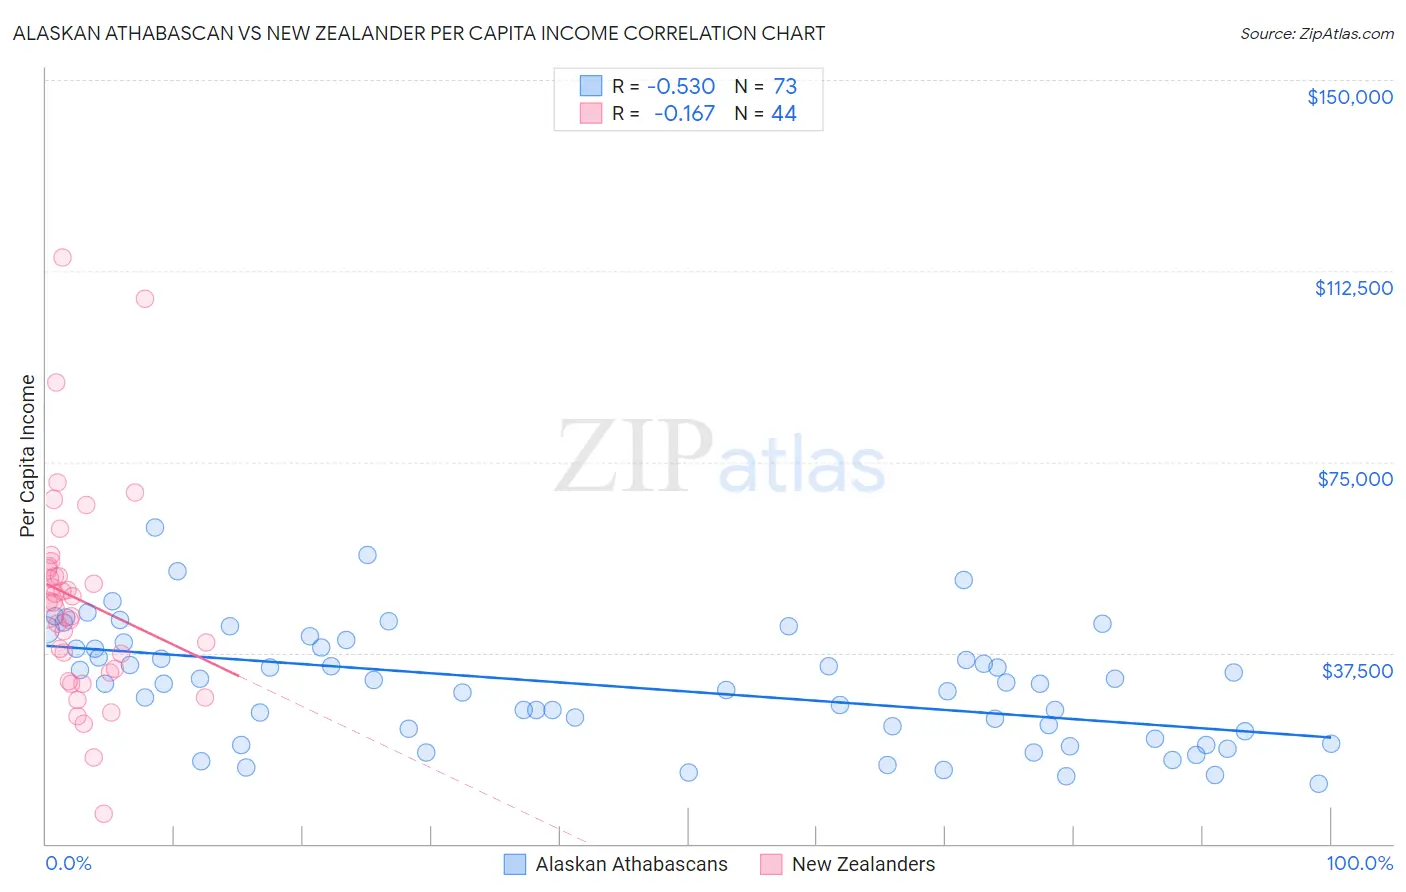
Alaskan Athabascan vs New Zealander Per Capita Income Correlation Chart
The statistical analysis conducted on geographies consisting of 45,821,401 people shows a substantial negative correlation between the proportion of Alaskan Athabascans and per capita income in the United States with a correlation coefficient (R) of -0.530 and weighted average of $39,163. Similarly, the statistical analysis conducted on geographies consisting of 106,919,498 people shows a poor negative correlation between the proportion of New Zealanders and per capita income in the United States with a correlation coefficient (R) of -0.167 and weighted average of $50,575, a difference of 29.1%.
Per Capita Income Correlation Summary
| Measurement | Alaskan Athabascan | New Zealander |
| Minimum | $11,811 | $5,784 |
| Maximum | $61,991 | $115,097 |
| Range | $50,180 | $109,313 |
| Mean | $31,098 | $47,922 |
| Median | $31,460 | $47,389 |
| Interquartile 25% (IQ1) | $21,337 | $34,042 |
| Interquartile 75% (IQ3) | $38,931 | $54,179 |
| Interquartile Range (IQR) | $17,594 | $20,137 |
| Standard Deviation (Sample) | $11,398 | $20,895 |
| Standard Deviation (Population) | $11,320 | $20,656 |
Similar Demographics by Per Capita Income
Demographics Similar to Alaskan Athabascans by Per Capita Income
In terms of per capita income, the demographic groups most similar to Alaskan Athabascans are Malaysian ($39,194, a difference of 0.080%), Marshallese ($39,108, a difference of 0.14%), Iroquois ($39,104, a difference of 0.15%), Jamaican ($39,231, a difference of 0.17%), and Belizean ($39,097, a difference of 0.17%).
| Demographics | Rating | Rank | Per Capita Income |
| Osage | 1.0 /100 | #253 | Tragic $39,568 |
| Alaska Natives | 1.0 /100 | #254 | Tragic $39,558 |
| Immigrants | Middle Africa | 1.0 /100 | #255 | Tragic $39,529 |
| Hawaiians | 0.8 /100 | #256 | Tragic $39,403 |
| Nicaraguans | 0.8 /100 | #257 | Tragic $39,372 |
| Jamaicans | 0.7 /100 | #258 | Tragic $39,231 |
| Malaysians | 0.7 /100 | #259 | Tragic $39,194 |
| Alaskan Athabascans | 0.6 /100 | #260 | Tragic $39,163 |
| Marshallese | 0.6 /100 | #261 | Tragic $39,108 |
| Iroquois | 0.6 /100 | #262 | Tragic $39,104 |
| Belizeans | 0.6 /100 | #263 | Tragic $39,097 |
| Americans | 0.6 /100 | #264 | Tragic $39,039 |
| Spanish Americans | 0.5 /100 | #265 | Tragic $39,012 |
| Salvadorans | 0.5 /100 | #266 | Tragic $38,858 |
| Immigrants | Zaire | 0.4 /100 | #267 | Tragic $38,848 |
Demographics Similar to New Zealanders by Per Capita Income
In terms of per capita income, the demographic groups most similar to New Zealanders are Immigrants from Sri Lanka ($50,555, a difference of 0.040%), Immigrants from Netherlands ($50,458, a difference of 0.23%), Immigrants from Croatia ($50,417, a difference of 0.31%), Paraguayan ($50,385, a difference of 0.38%), and Immigrants from Serbia ($50,810, a difference of 0.46%).
| Demographics | Rating | Rank | Per Capita Income |
| Immigrants | Turkey | 100.0 /100 | #42 | Exceptional $51,368 |
| Immigrants | Lithuania | 100.0 /100 | #43 | Exceptional $51,361 |
| Immigrants | Europe | 100.0 /100 | #44 | Exceptional $50,950 |
| Immigrants | Spain | 100.0 /100 | #45 | Exceptional $50,933 |
| Immigrants | Latvia | 100.0 /100 | #46 | Exceptional $50,914 |
| Bulgarians | 100.0 /100 | #47 | Exceptional $50,906 |
| Immigrants | Serbia | 100.0 /100 | #48 | Exceptional $50,810 |
| New Zealanders | 100.0 /100 | #49 | Exceptional $50,575 |
| Immigrants | Sri Lanka | 100.0 /100 | #50 | Exceptional $50,555 |
| Immigrants | Netherlands | 100.0 /100 | #51 | Exceptional $50,458 |
| Immigrants | Croatia | 99.9 /100 | #52 | Exceptional $50,417 |
| Paraguayans | 99.9 /100 | #53 | Exceptional $50,385 |
| Immigrants | Belarus | 99.9 /100 | #54 | Exceptional $50,303 |
| Immigrants | Western Europe | 99.9 /100 | #55 | Exceptional $50,065 |
| Asians | 99.9 /100 | #56 | Exceptional $50,057 |