Immigrants vs French Canadian Median Male Earnings
COMPARE
Immigrants
French Canadian
Median Male Earnings
Median Male Earnings Comparison
Immigrants
French Canadians
$54,168
MEDIAN MALE EARNINGS
42.1/ 100
METRIC RATING
181st/ 347
METRIC RANK
$54,722
MEDIAN MALE EARNINGS
55.6/ 100
METRIC RATING
169th/ 347
METRIC RANK
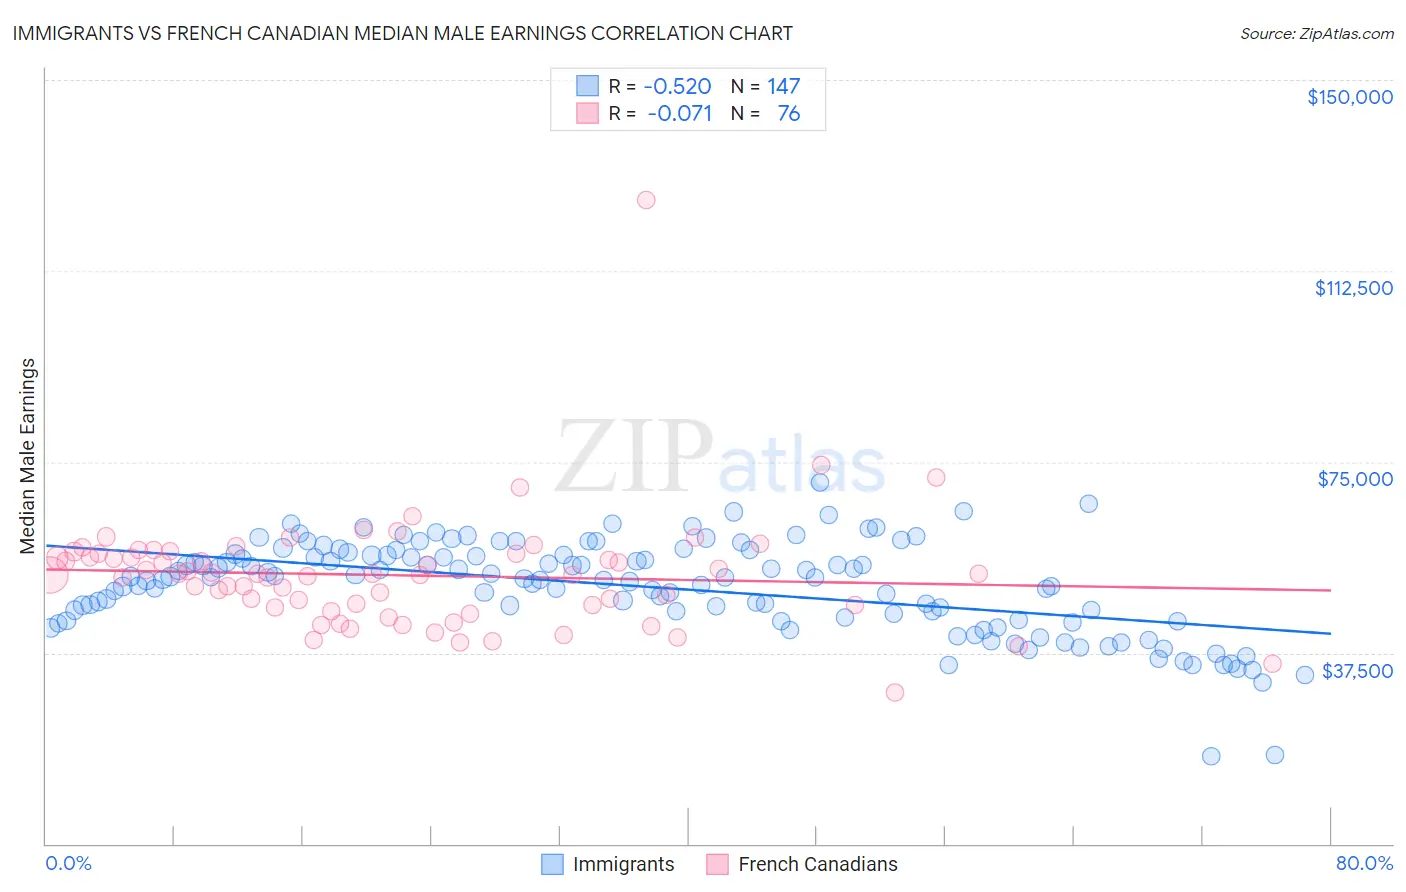
Immigrants vs French Canadian Median Male Earnings Correlation Chart
The statistical analysis conducted on geographies consisting of 575,766,345 people shows a substantial negative correlation between the proportion of Immigrants and median male earnings in the United States with a correlation coefficient (R) of -0.520 and weighted average of $54,168. Similarly, the statistical analysis conducted on geographies consisting of 502,178,853 people shows a slight negative correlation between the proportion of French Canadians and median male earnings in the United States with a correlation coefficient (R) of -0.071 and weighted average of $54,722, a difference of 1.0%.
Median Male Earnings Correlation Summary
| Measurement | Immigrants | French Canadian |
| Minimum | $17,250 | $29,821 |
| Maximum | $71,068 | $126,333 |
| Range | $53,818 | $96,512 |
| Mean | $50,484 | $52,728 |
| Median | $52,327 | $52,909 |
| Interquartile 25% (IQ1) | $44,402 | $46,602 |
| Interquartile 75% (IQ3) | $56,800 | $56,878 |
| Interquartile Range (IQR) | $12,398 | $10,277 |
| Standard Deviation (Sample) | $9,155 | $11,742 |
| Standard Deviation (Population) | $9,124 | $11,665 |
Demographics Similar to Immigrants and French Canadians by Median Male Earnings
In terms of median male earnings, the demographic groups most similar to Immigrants are Iraqi ($54,182, a difference of 0.030%), Celtic ($54,242, a difference of 0.14%), Costa Rican ($54,279, a difference of 0.21%), Sierra Leonean ($54,279, a difference of 0.21%), and Yugoslavian ($53,967, a difference of 0.37%). Similarly, the demographic groups most similar to French Canadians are Finnish ($54,721, a difference of 0.0%), Immigrants from Peru ($54,695, a difference of 0.050%), Welsh ($54,647, a difference of 0.14%), Immigrants from Vietnam ($54,913, a difference of 0.35%), and South American Indian ($54,508, a difference of 0.39%).
| Demographics | Rating | Rank | Median Male Earnings |
| Immigrants | Portugal | 66.3 /100 | #165 | Good $55,182 |
| Germans | 61.6 /100 | #166 | Good $54,974 |
| Immigrants | Fiji | 61.2 /100 | #167 | Good $54,958 |
| Immigrants | Vietnam | 60.2 /100 | #168 | Good $54,913 |
| French Canadians | 55.6 /100 | #169 | Average $54,722 |
| Finns | 55.6 /100 | #170 | Average $54,721 |
| Immigrants | Peru | 54.9 /100 | #171 | Average $54,695 |
| Welsh | 53.8 /100 | #172 | Average $54,647 |
| South American Indians | 50.4 /100 | #173 | Average $54,508 |
| South Americans | 50.0 /100 | #174 | Average $54,492 |
| Dutch | 48.0 /100 | #175 | Average $54,410 |
| Spaniards | 47.8 /100 | #176 | Average $54,401 |
| Costa Ricans | 44.8 /100 | #177 | Average $54,279 |
| Sierra Leoneans | 44.8 /100 | #178 | Average $54,279 |
| Celtics | 43.9 /100 | #179 | Average $54,242 |
| Iraqis | 42.5 /100 | #180 | Average $54,182 |
| Immigrants | Immigrants | 42.1 /100 | #181 | Average $54,168 |
| Yugoslavians | 37.4 /100 | #182 | Fair $53,967 |
| Immigrants | South America | 37.3 /100 | #183 | Fair $53,962 |
| Whites/Caucasians | 36.5 /100 | #184 | Fair $53,925 |
| Immigrants | Sierra Leone | 36.0 /100 | #185 | Fair $53,905 |