Seminole vs French Canadian Median Male Earnings
COMPARE
Seminole
French Canadian
Median Male Earnings
Median Male Earnings Comparison
Seminole
French Canadians
$46,783
MEDIAN MALE EARNINGS
0.1/ 100
METRIC RATING
302nd/ 347
METRIC RANK
$54,722
MEDIAN MALE EARNINGS
55.6/ 100
METRIC RATING
169th/ 347
METRIC RANK
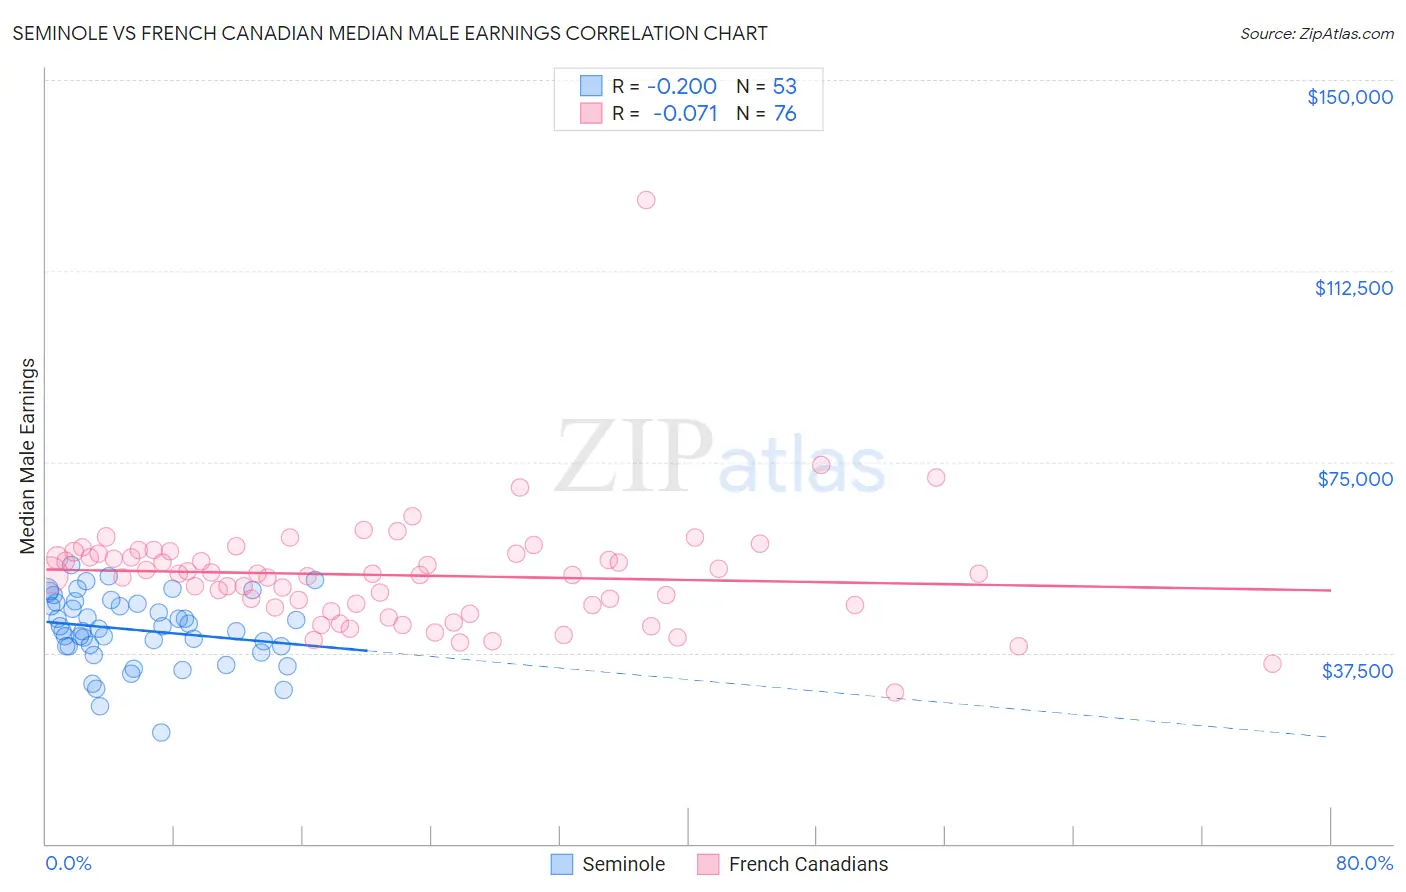
Seminole vs French Canadian Median Male Earnings Correlation Chart
The statistical analysis conducted on geographies consisting of 118,283,332 people shows a poor negative correlation between the proportion of Seminole and median male earnings in the United States with a correlation coefficient (R) of -0.200 and weighted average of $46,783. Similarly, the statistical analysis conducted on geographies consisting of 502,178,853 people shows a slight negative correlation between the proportion of French Canadians and median male earnings in the United States with a correlation coefficient (R) of -0.071 and weighted average of $54,722, a difference of 17.0%.
Median Male Earnings Correlation Summary
| Measurement | Seminole | French Canadian |
| Minimum | $21,845 | $29,821 |
| Maximum | $54,701 | $126,333 |
| Range | $32,856 | $96,512 |
| Mean | $41,991 | $52,728 |
| Median | $42,165 | $52,909 |
| Interquartile 25% (IQ1) | $38,676 | $46,602 |
| Interquartile 75% (IQ3) | $47,251 | $56,878 |
| Interquartile Range (IQR) | $8,575 | $10,277 |
| Standard Deviation (Sample) | $6,861 | $11,742 |
| Standard Deviation (Population) | $6,796 | $11,665 |
Similar Demographics by Median Male Earnings
Demographics Similar to Seminole by Median Male Earnings
In terms of median male earnings, the demographic groups most similar to Seminole are Yaqui ($46,777, a difference of 0.010%), Bangladeshi ($46,744, a difference of 0.080%), Guatemalan ($46,736, a difference of 0.10%), Dutch West Indian ($46,656, a difference of 0.27%), and Immigrants from Dominican Republic ($46,655, a difference of 0.27%).
| Demographics | Rating | Rank | Median Male Earnings |
| Central American Indians | 0.1 /100 | #295 | Tragic $47,433 |
| Inupiat | 0.1 /100 | #296 | Tragic $47,281 |
| Dominicans | 0.1 /100 | #297 | Tragic $47,204 |
| Immigrants | Micronesia | 0.1 /100 | #298 | Tragic $47,177 |
| Immigrants | Zaire | 0.1 /100 | #299 | Tragic $47,070 |
| U.S. Virgin Islanders | 0.1 /100 | #300 | Tragic $47,066 |
| Immigrants | Latin America | 0.1 /100 | #301 | Tragic $46,941 |
| Seminole | 0.1 /100 | #302 | Tragic $46,783 |
| Yaqui | 0.1 /100 | #303 | Tragic $46,777 |
| Bangladeshis | 0.1 /100 | #304 | Tragic $46,744 |
| Guatemalans | 0.0 /100 | #305 | Tragic $46,736 |
| Dutch West Indians | 0.0 /100 | #306 | Tragic $46,656 |
| Immigrants | Dominican Republic | 0.0 /100 | #307 | Tragic $46,655 |
| Ottawa | 0.0 /100 | #308 | Tragic $46,611 |
| Creek | 0.0 /100 | #309 | Tragic $46,594 |
Demographics Similar to French Canadians by Median Male Earnings
In terms of median male earnings, the demographic groups most similar to French Canadians are Finnish ($54,721, a difference of 0.0%), Immigrants from Peru ($54,695, a difference of 0.050%), Welsh ($54,647, a difference of 0.14%), Immigrants from Vietnam ($54,913, a difference of 0.35%), and South American Indian ($54,508, a difference of 0.39%).
| Demographics | Rating | Rank | Median Male Earnings |
| French | 69.9 /100 | #162 | Good $55,350 |
| Ugandans | 68.6 /100 | #163 | Good $55,290 |
| Immigrants | South Eastern Asia | 67.6 /100 | #164 | Good $55,241 |
| Immigrants | Portugal | 66.3 /100 | #165 | Good $55,182 |
| Germans | 61.6 /100 | #166 | Good $54,974 |
| Immigrants | Fiji | 61.2 /100 | #167 | Good $54,958 |
| Immigrants | Vietnam | 60.2 /100 | #168 | Good $54,913 |
| French Canadians | 55.6 /100 | #169 | Average $54,722 |
| Finns | 55.6 /100 | #170 | Average $54,721 |
| Immigrants | Peru | 54.9 /100 | #171 | Average $54,695 |
| Welsh | 53.8 /100 | #172 | Average $54,647 |
| South American Indians | 50.4 /100 | #173 | Average $54,508 |
| South Americans | 50.0 /100 | #174 | Average $54,492 |
| Dutch | 48.0 /100 | #175 | Average $54,410 |
| Spaniards | 47.8 /100 | #176 | Average $54,401 |