Alaskan Athabascan vs French Canadian Professional Degree
COMPARE
Alaskan Athabascan
French Canadian
Professional Degree
Professional Degree Comparison
Alaskan Athabascans
French Canadians
3.8%
PROFESSIONAL DEGREE
2.3/ 100
METRIC RATING
241st/ 347
METRIC RANK
4.0%
PROFESSIONAL DEGREE
8.0/ 100
METRIC RATING
221st/ 347
METRIC RANK
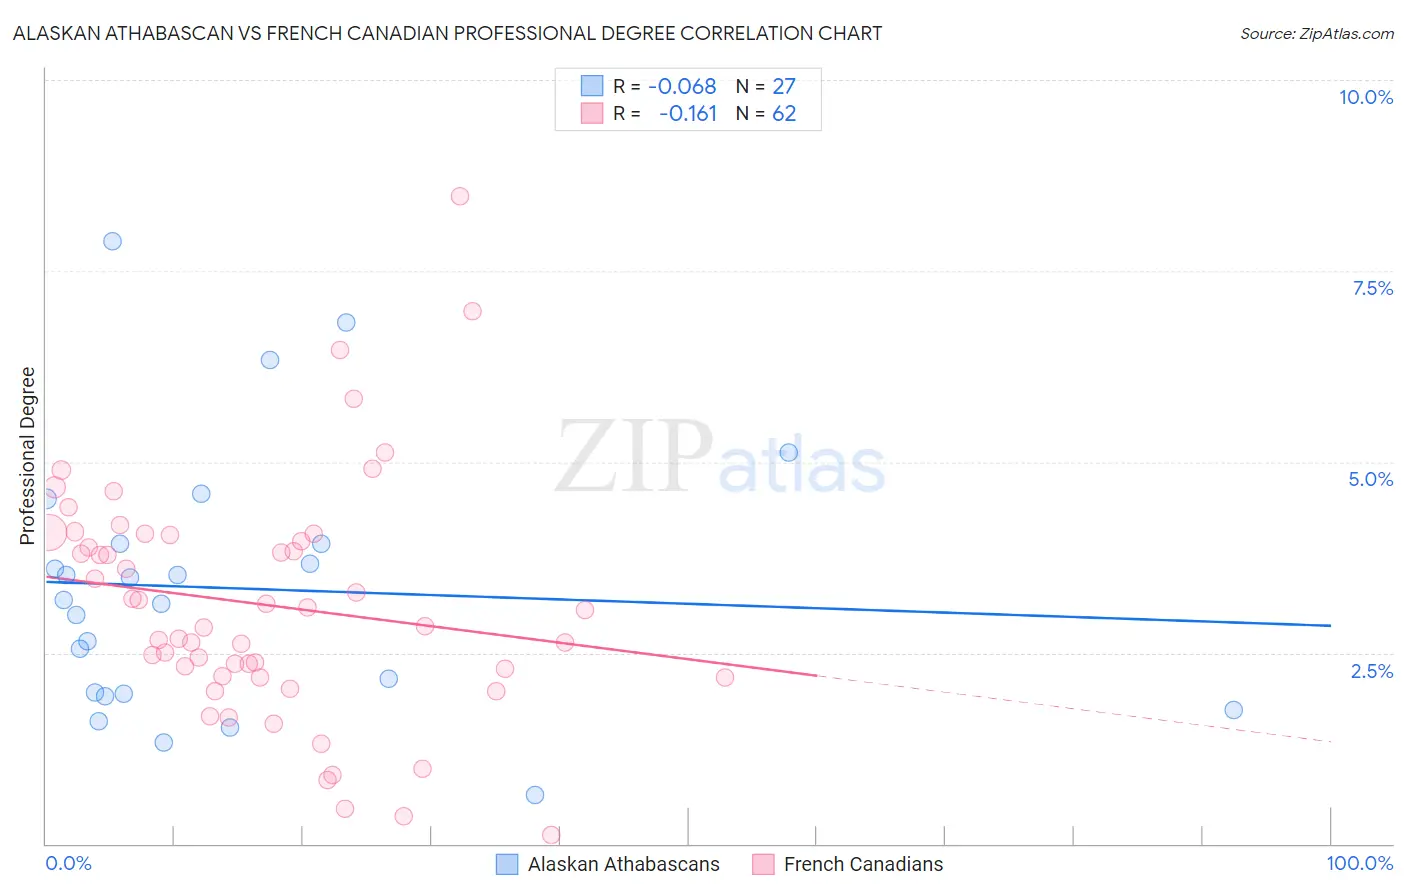
Alaskan Athabascan vs French Canadian Professional Degree Correlation Chart
The statistical analysis conducted on geographies consisting of 45,732,326 people shows a slight negative correlation between the proportion of Alaskan Athabascans and percentage of population with at least professional degree education in the United States with a correlation coefficient (R) of -0.068 and weighted average of 3.8%. Similarly, the statistical analysis conducted on geographies consisting of 499,387,029 people shows a poor negative correlation between the proportion of French Canadians and percentage of population with at least professional degree education in the United States with a correlation coefficient (R) of -0.161 and weighted average of 4.0%, a difference of 5.5%.
Professional Degree Correlation Summary
| Measurement | Alaskan Athabascan | French Canadian |
| Minimum | 0.64% | 0.11% |
| Maximum | 7.9% | 8.5% |
| Range | 7.2% | 8.4% |
| Mean | 3.3% | 3.1% |
| Median | 3.2% | 3.0% |
| Interquartile 25% (IQ1) | 2.0% | 2.2% |
| Interquartile 75% (IQ3) | 3.9% | 4.0% |
| Interquartile Range (IQR) | 2.0% | 1.8% |
| Standard Deviation (Sample) | 1.7% | 1.6% |
| Standard Deviation (Population) | 1.7% | 1.5% |
Demographics Similar to Alaskan Athabascans and French Canadians by Professional Degree
In terms of professional degree, the demographic groups most similar to Alaskan Athabascans are Immigrants from Ecuador (3.8%, a difference of 0.020%), British West Indian (3.8%, a difference of 0.25%), Colville (3.8%, a difference of 0.64%), Immigrants from Trinidad and Tobago (3.9%, a difference of 2.2%), and Spanish American (3.9%, a difference of 2.3%). Similarly, the demographic groups most similar to French Canadians are Immigrants from Western Africa (4.0%, a difference of 0.25%), Immigrants from Bosnia and Herzegovina (4.0%, a difference of 0.33%), Trinidadian and Tobagonian (4.0%, a difference of 0.47%), Tlingit-Haida (4.0%, a difference of 0.60%), and German Russian (4.0%, a difference of 1.2%).
| Demographics | Rating | Rank | Professional Degree |
| French Canadians | 8.0 /100 | #221 | Tragic 4.0% |
| Immigrants | Western Africa | 7.5 /100 | #222 | Tragic 4.0% |
| Immigrants | Bosnia and Herzegovina | 7.4 /100 | #223 | Tragic 4.0% |
| Trinidadians and Tobagonians | 7.1 /100 | #224 | Tragic 4.0% |
| Tlingit-Haida | 6.9 /100 | #225 | Tragic 4.0% |
| German Russians | 6.1 /100 | #226 | Tragic 4.0% |
| Cubans | 5.9 /100 | #227 | Tragic 4.0% |
| Immigrants | West Indies | 5.6 /100 | #228 | Tragic 4.0% |
| Immigrants | Burma/Myanmar | 5.4 /100 | #229 | Tragic 3.9% |
| Nicaraguans | 5.1 /100 | #230 | Tragic 3.9% |
| Ecuadorians | 4.6 /100 | #231 | Tragic 3.9% |
| Cree | 4.3 /100 | #232 | Tragic 3.9% |
| Immigrants | Philippines | 4.1 /100 | #233 | Tragic 3.9% |
| Immigrants | Nonimmigrants | 4.0 /100 | #234 | Tragic 3.9% |
| Immigrants | Barbados | 4.0 /100 | #235 | Tragic 3.9% |
| Spanish Americans | 3.8 /100 | #236 | Tragic 3.9% |
| Immigrants | Trinidad and Tobago | 3.8 /100 | #237 | Tragic 3.9% |
| Colville | 2.6 /100 | #238 | Tragic 3.8% |
| British West Indians | 2.4 /100 | #239 | Tragic 3.8% |
| Immigrants | Ecuador | 2.3 /100 | #240 | Tragic 3.8% |
| Alaskan Athabascans | 2.3 /100 | #241 | Tragic 3.8% |