African vs Paiute Householder Income Over 65 years
COMPARE
African
Paiute
Householder Income Over 65 years
Householder Income Over 65 years Comparison
Africans
Paiute
$53,711
HOUSEHOLDER INCOME OVER 65 YEARS
0.0/ 100
METRIC RATING
291st/ 347
METRIC RANK
$53,762
HOUSEHOLDER INCOME OVER 65 YEARS
0.1/ 100
METRIC RATING
288th/ 347
METRIC RANK
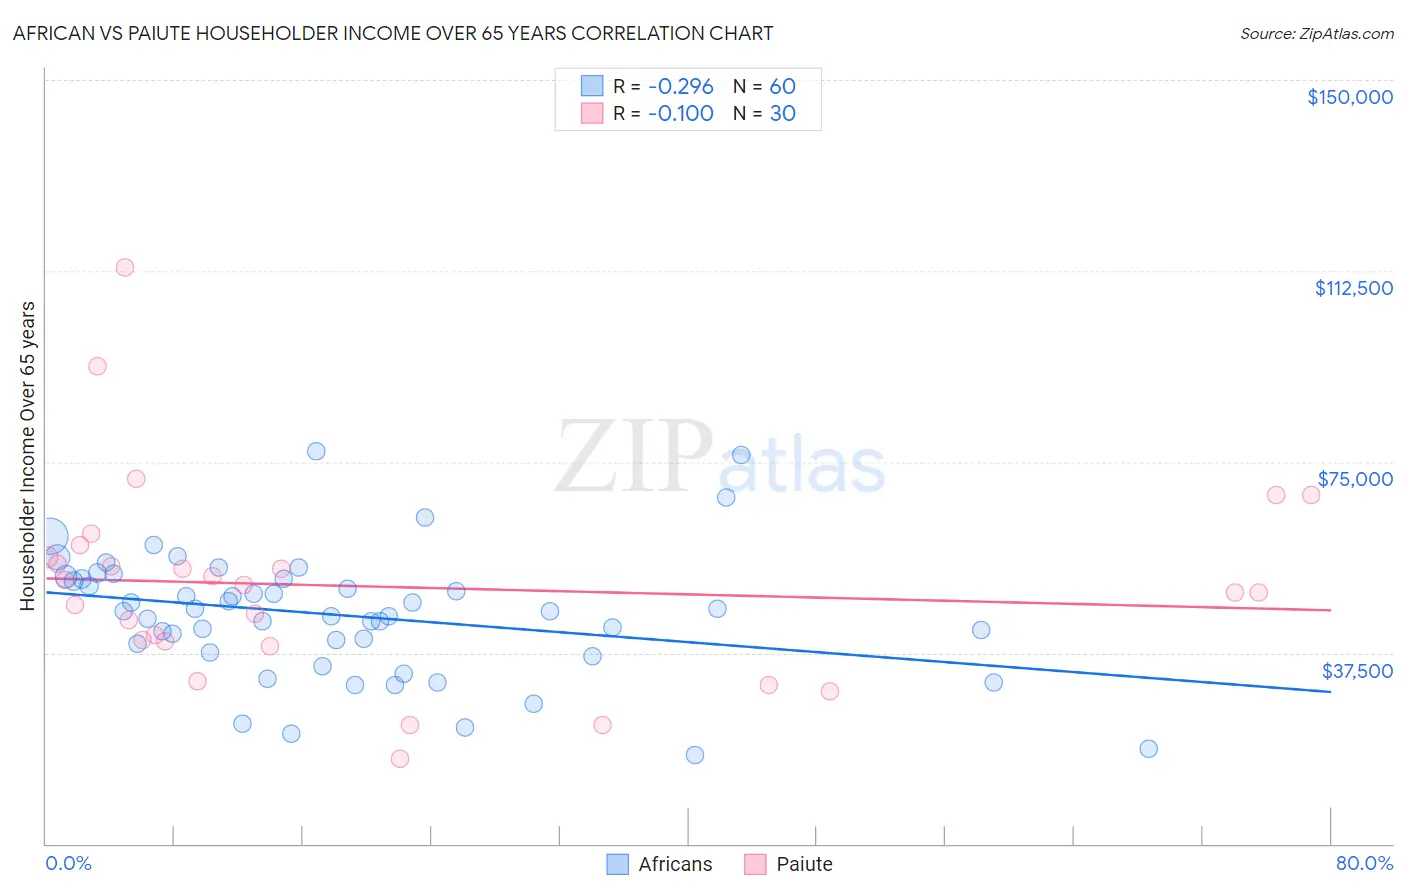
African vs Paiute Householder Income Over 65 years Correlation Chart
The statistical analysis conducted on geographies consisting of 467,455,412 people shows a weak negative correlation between the proportion of Africans and household income with householder over the age of 65 in the United States with a correlation coefficient (R) of -0.296 and weighted average of $53,711. Similarly, the statistical analysis conducted on geographies consisting of 58,330,101 people shows a slight negative correlation between the proportion of Paiute and household income with householder over the age of 65 in the United States with a correlation coefficient (R) of -0.100 and weighted average of $53,762, a difference of 0.090%.
Householder Income Over 65 years Correlation Summary
| Measurement | African | Paiute |
| Minimum | $17,550 | $16,667 |
| Maximum | $77,178 | $113,167 |
| Range | $59,628 | $96,500 |
| Mean | $44,897 | $50,506 |
| Median | $45,715 | $50,125 |
| Interquartile 25% (IQ1) | $38,427 | $39,874 |
| Interquartile 75% (IQ3) | $51,942 | $56,261 |
| Interquartile Range (IQR) | $13,515 | $16,387 |
| Standard Deviation (Sample) | $12,357 | $19,872 |
| Standard Deviation (Population) | $12,253 | $19,538 |
Demographics Similar to Africans and Paiute by Householder Income Over 65 years
In terms of householder income over 65 years, the demographic groups most similar to Africans are Chickasaw ($53,732, a difference of 0.040%), Iroquois ($53,737, a difference of 0.050%), Shoshone ($53,681, a difference of 0.060%), Immigrants from Belize ($53,665, a difference of 0.090%), and Immigrants from Barbados ($53,766, a difference of 0.10%). Similarly, the demographic groups most similar to Paiute are Immigrants from Barbados ($53,766, a difference of 0.010%), Iroquois ($53,737, a difference of 0.050%), Chickasaw ($53,732, a difference of 0.060%), Shoshone ($53,681, a difference of 0.15%), and Chippewa ($53,847, a difference of 0.16%).
| Demographics | Rating | Rank | Householder Income Over 65 years |
| Blackfeet | 0.1 /100 | #279 | Tragic $54,029 |
| Immigrants | Jamaica | 0.1 /100 | #280 | Tragic $54,027 |
| Somalis | 0.1 /100 | #281 | Tragic $54,004 |
| Immigrants | Armenia | 0.1 /100 | #282 | Tragic $53,974 |
| Immigrants | Liberia | 0.1 /100 | #283 | Tragic $53,967 |
| Immigrants | Guatemala | 0.1 /100 | #284 | Tragic $53,950 |
| Mexicans | 0.1 /100 | #285 | Tragic $53,897 |
| Chippewa | 0.1 /100 | #286 | Tragic $53,847 |
| Immigrants | Barbados | 0.1 /100 | #287 | Tragic $53,766 |
| Paiute | 0.1 /100 | #288 | Tragic $53,762 |
| Iroquois | 0.1 /100 | #289 | Tragic $53,737 |
| Chickasaw | 0.1 /100 | #290 | Tragic $53,732 |
| Africans | 0.0 /100 | #291 | Tragic $53,711 |
| Shoshone | 0.0 /100 | #292 | Tragic $53,681 |
| Immigrants | Belize | 0.0 /100 | #293 | Tragic $53,665 |
| Senegalese | 0.0 /100 | #294 | Tragic $53,591 |
| Immigrants | Central America | 0.0 /100 | #295 | Tragic $53,420 |
| Immigrants | Somalia | 0.0 /100 | #296 | Tragic $53,333 |
| Immigrants | Latin America | 0.0 /100 | #297 | Tragic $53,265 |
| Central American Indians | 0.0 /100 | #298 | Tragic $53,232 |
| Ottawa | 0.0 /100 | #299 | Tragic $53,217 |