African vs Indonesian Householder Income Over 65 years
COMPARE
African
Indonesian
Householder Income Over 65 years
Householder Income Over 65 years Comparison
Africans
Indonesians
$53,711
HOUSEHOLDER INCOME OVER 65 YEARS
0.0/ 100
METRIC RATING
291st/ 347
METRIC RANK
$54,176
HOUSEHOLDER INCOME OVER 65 YEARS
0.1/ 100
METRIC RATING
273rd/ 347
METRIC RANK
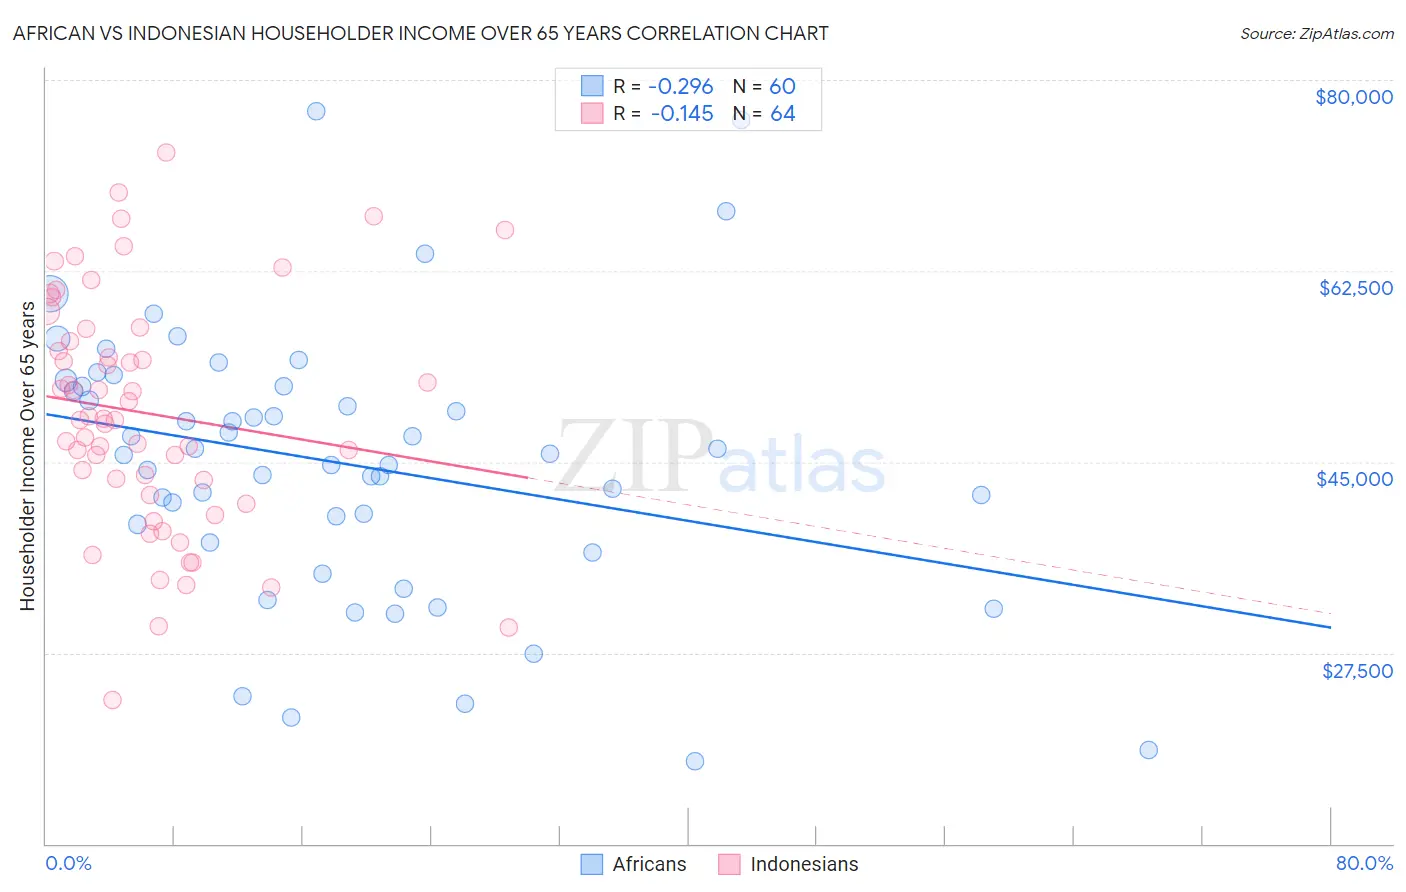
African vs Indonesian Householder Income Over 65 years Correlation Chart
The statistical analysis conducted on geographies consisting of 467,455,412 people shows a weak negative correlation between the proportion of Africans and household income with householder over the age of 65 in the United States with a correlation coefficient (R) of -0.296 and weighted average of $53,711. Similarly, the statistical analysis conducted on geographies consisting of 162,395,174 people shows a poor negative correlation between the proportion of Indonesians and household income with householder over the age of 65 in the United States with a correlation coefficient (R) of -0.145 and weighted average of $54,176, a difference of 0.87%.
Householder Income Over 65 years Correlation Summary
| Measurement | African | Indonesian |
| Minimum | $17,550 | $23,126 |
| Maximum | $77,178 | $73,361 |
| Range | $59,628 | $50,235 |
| Mean | $44,897 | $49,441 |
| Median | $45,715 | $48,888 |
| Interquartile 25% (IQ1) | $38,427 | $42,656 |
| Interquartile 75% (IQ3) | $51,942 | $56,577 |
| Interquartile Range (IQR) | $13,515 | $13,920 |
| Standard Deviation (Sample) | $12,357 | $10,775 |
| Standard Deviation (Population) | $12,253 | $10,690 |
Demographics Similar to Africans and Indonesians by Householder Income Over 65 years
In terms of householder income over 65 years, the demographic groups most similar to Africans are Chickasaw ($53,732, a difference of 0.040%), Iroquois ($53,737, a difference of 0.050%), Shoshone ($53,681, a difference of 0.060%), Paiute ($53,762, a difference of 0.090%), and Immigrants from Barbados ($53,766, a difference of 0.10%). Similarly, the demographic groups most similar to Indonesians are Barbadian ($54,163, a difference of 0.020%), Potawatomi ($54,212, a difference of 0.070%), Cherokee ($54,133, a difference of 0.080%), Cree ($54,129, a difference of 0.090%), and Cheyenne ($54,096, a difference of 0.15%).
| Demographics | Rating | Rank | Householder Income Over 65 years |
| Potawatomi | 0.1 /100 | #272 | Tragic $54,212 |
| Indonesians | 0.1 /100 | #273 | Tragic $54,176 |
| Barbadians | 0.1 /100 | #274 | Tragic $54,163 |
| Cherokee | 0.1 /100 | #275 | Tragic $54,133 |
| Cree | 0.1 /100 | #276 | Tragic $54,129 |
| Cheyenne | 0.1 /100 | #277 | Tragic $54,096 |
| Immigrants | Ecuador | 0.1 /100 | #278 | Tragic $54,030 |
| Blackfeet | 0.1 /100 | #279 | Tragic $54,029 |
| Immigrants | Jamaica | 0.1 /100 | #280 | Tragic $54,027 |
| Somalis | 0.1 /100 | #281 | Tragic $54,004 |
| Immigrants | Armenia | 0.1 /100 | #282 | Tragic $53,974 |
| Immigrants | Liberia | 0.1 /100 | #283 | Tragic $53,967 |
| Immigrants | Guatemala | 0.1 /100 | #284 | Tragic $53,950 |
| Mexicans | 0.1 /100 | #285 | Tragic $53,897 |
| Chippewa | 0.1 /100 | #286 | Tragic $53,847 |
| Immigrants | Barbados | 0.1 /100 | #287 | Tragic $53,766 |
| Paiute | 0.1 /100 | #288 | Tragic $53,762 |
| Iroquois | 0.1 /100 | #289 | Tragic $53,737 |
| Chickasaw | 0.1 /100 | #290 | Tragic $53,732 |
| Africans | 0.0 /100 | #291 | Tragic $53,711 |
| Shoshone | 0.0 /100 | #292 | Tragic $53,681 |