African vs Immigrants from Eritrea 7th Grade
COMPARE
African
Immigrants from Eritrea
7th Grade
7th Grade Comparison
Africans
Immigrants from Eritrea
95.8%
7TH GRADE
17.6/ 100
METRIC RATING
206th/ 347
METRIC RANK
94.9%
7TH GRADE
0.1/ 100
METRIC RATING
285th/ 347
METRIC RANK
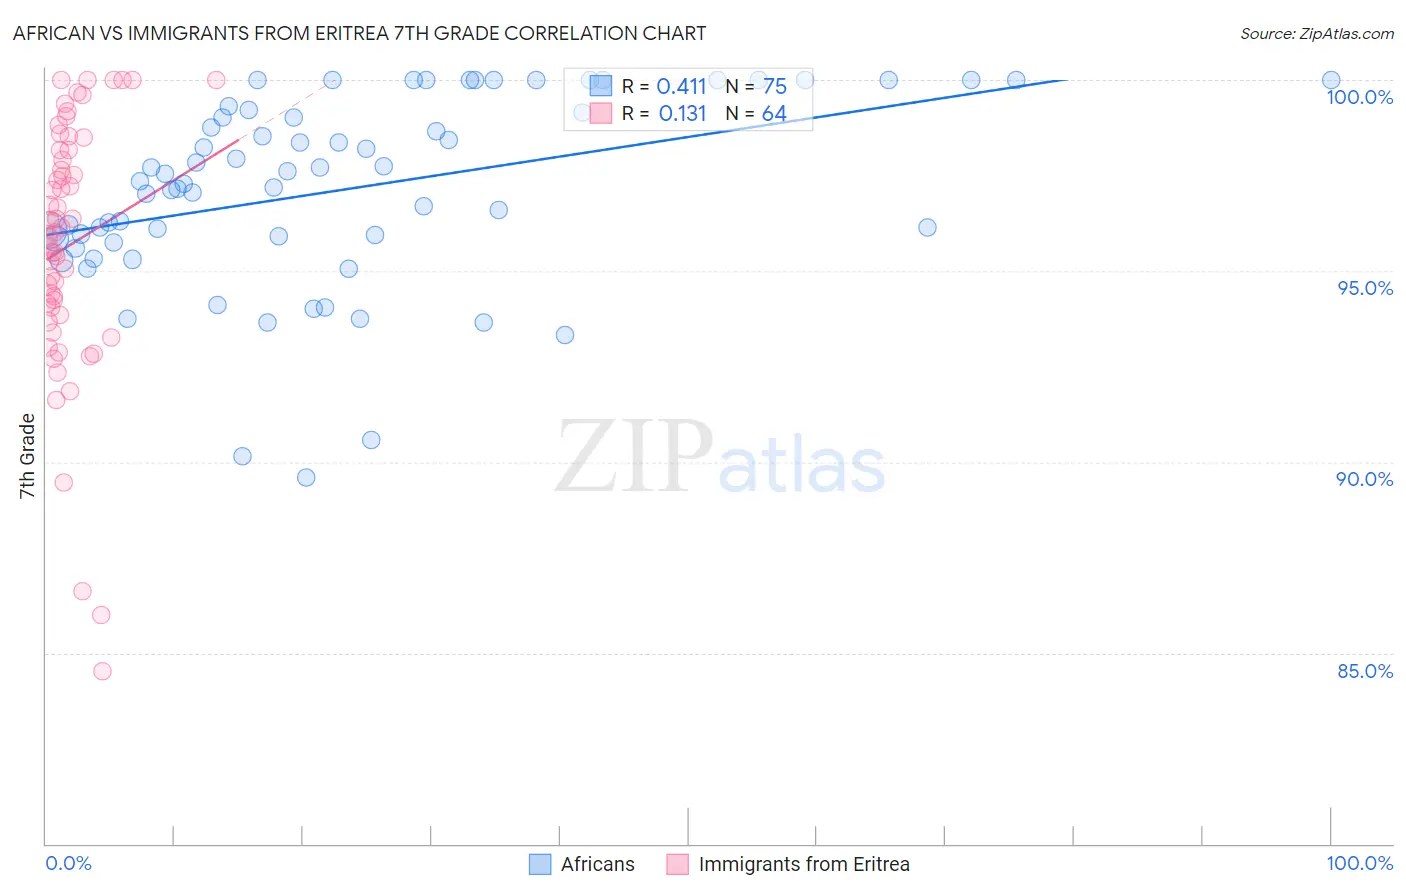
African vs Immigrants from Eritrea 7th Grade Correlation Chart
The statistical analysis conducted on geographies consisting of 470,094,744 people shows a moderate positive correlation between the proportion of Africans and percentage of population with at least 7th grade education in the United States with a correlation coefficient (R) of 0.411 and weighted average of 95.8%. Similarly, the statistical analysis conducted on geographies consisting of 104,754,230 people shows a poor positive correlation between the proportion of Immigrants from Eritrea and percentage of population with at least 7th grade education in the United States with a correlation coefficient (R) of 0.131 and weighted average of 94.9%, a difference of 0.91%.
7th Grade Correlation Summary
| Measurement | African | Immigrants from Eritrea |
| Minimum | 89.6% | 84.5% |
| Maximum | 100.0% | 100.0% |
| Range | 10.4% | 15.5% |
| Mean | 97.1% | 95.7% |
| Median | 97.3% | 96.0% |
| Interquartile 25% (IQ1) | 95.9% | 93.9% |
| Interquartile 75% (IQ3) | 99.2% | 98.2% |
| Interquartile Range (IQR) | 3.4% | 4.2% |
| Standard Deviation (Sample) | 2.5% | 3.4% |
| Standard Deviation (Population) | 2.5% | 3.3% |
Similar Demographics by 7th Grade
Demographics Similar to Africans by 7th Grade
In terms of 7th grade, the demographic groups most similar to Africans are Moroccan (95.8%, a difference of 0.010%), Navajo (95.8%, a difference of 0.010%), Immigrants from Sudan (95.8%, a difference of 0.010%), Dutch West Indian (95.8%, a difference of 0.020%), and Hawaiian (95.8%, a difference of 0.020%).
| Demographics | Rating | Rank | 7th Grade |
| Guamanians/Chamorros | 23.5 /100 | #199 | Fair 95.9% |
| Argentineans | 23.2 /100 | #200 | Fair 95.9% |
| Immigrants | Argentina | 21.9 /100 | #201 | Fair 95.9% |
| Immigrants | Northern Africa | 21.4 /100 | #202 | Fair 95.8% |
| Comanche | 21.1 /100 | #203 | Fair 95.8% |
| Assyrians/Chaldeans/Syriacs | 20.5 /100 | #204 | Fair 95.8% |
| Moroccans | 18.9 /100 | #205 | Poor 95.8% |
| Africans | 17.6 /100 | #206 | Poor 95.8% |
| Navajo | 17.0 /100 | #207 | Poor 95.8% |
| Immigrants | Sudan | 17.0 /100 | #208 | Poor 95.8% |
| Dutch West Indians | 16.1 /100 | #209 | Poor 95.8% |
| Hawaiians | 16.0 /100 | #210 | Poor 95.8% |
| Portuguese | 13.6 /100 | #211 | Poor 95.8% |
| Immigrants | Lebanon | 13.0 /100 | #212 | Poor 95.8% |
| Immigrants | Morocco | 12.6 /100 | #213 | Poor 95.8% |
Demographics Similar to Immigrants from Eritrea by 7th Grade
In terms of 7th grade, the demographic groups most similar to Immigrants from Eritrea are Immigrants from Barbados (95.0%, a difference of 0.010%), Armenian (95.0%, a difference of 0.010%), Immigrants from Bolivia (95.0%, a difference of 0.070%), Immigrants from St. Vincent and the Grenadines (95.0%, a difference of 0.080%), and Tohono O'odham (95.0%, a difference of 0.080%).
| Demographics | Rating | Rank | 7th Grade |
| Immigrants | Trinidad and Tobago | 0.1 /100 | #278 | Tragic 95.1% |
| Barbadians | 0.1 /100 | #279 | Tragic 95.1% |
| Immigrants | St. Vincent and the Grenadines | 0.1 /100 | #280 | Tragic 95.0% |
| Tohono O'odham | 0.1 /100 | #281 | Tragic 95.0% |
| Immigrants | Bolivia | 0.1 /100 | #282 | Tragic 95.0% |
| Immigrants | Barbados | 0.1 /100 | #283 | Tragic 95.0% |
| Armenians | 0.1 /100 | #284 | Tragic 95.0% |
| Immigrants | Eritrea | 0.1 /100 | #285 | Tragic 94.9% |
| Immigrants | Philippines | 0.0 /100 | #286 | Tragic 94.9% |
| Immigrants | Peru | 0.0 /100 | #287 | Tragic 94.9% |
| British West Indians | 0.0 /100 | #288 | Tragic 94.8% |
| Taiwanese | 0.0 /100 | #289 | Tragic 94.8% |
| Malaysians | 0.0 /100 | #290 | Tragic 94.8% |
| Immigrants | Grenada | 0.0 /100 | #291 | Tragic 94.8% |
| Immigrants | West Indies | 0.0 /100 | #292 | Tragic 94.8% |