Spanish vs Immigrants from Eritrea Median Household Income
COMPARE
Spanish
Immigrants from Eritrea
Median Household Income
Median Household Income Comparison
Spanish
Immigrants from Eritrea
$83,343
MEDIAN HOUSEHOLD INCOME
24.4/ 100
METRIC RATING
201st/ 347
METRIC RANK
$85,025
MEDIAN HOUSEHOLD INCOME
48.8/ 100
METRIC RATING
177th/ 347
METRIC RANK
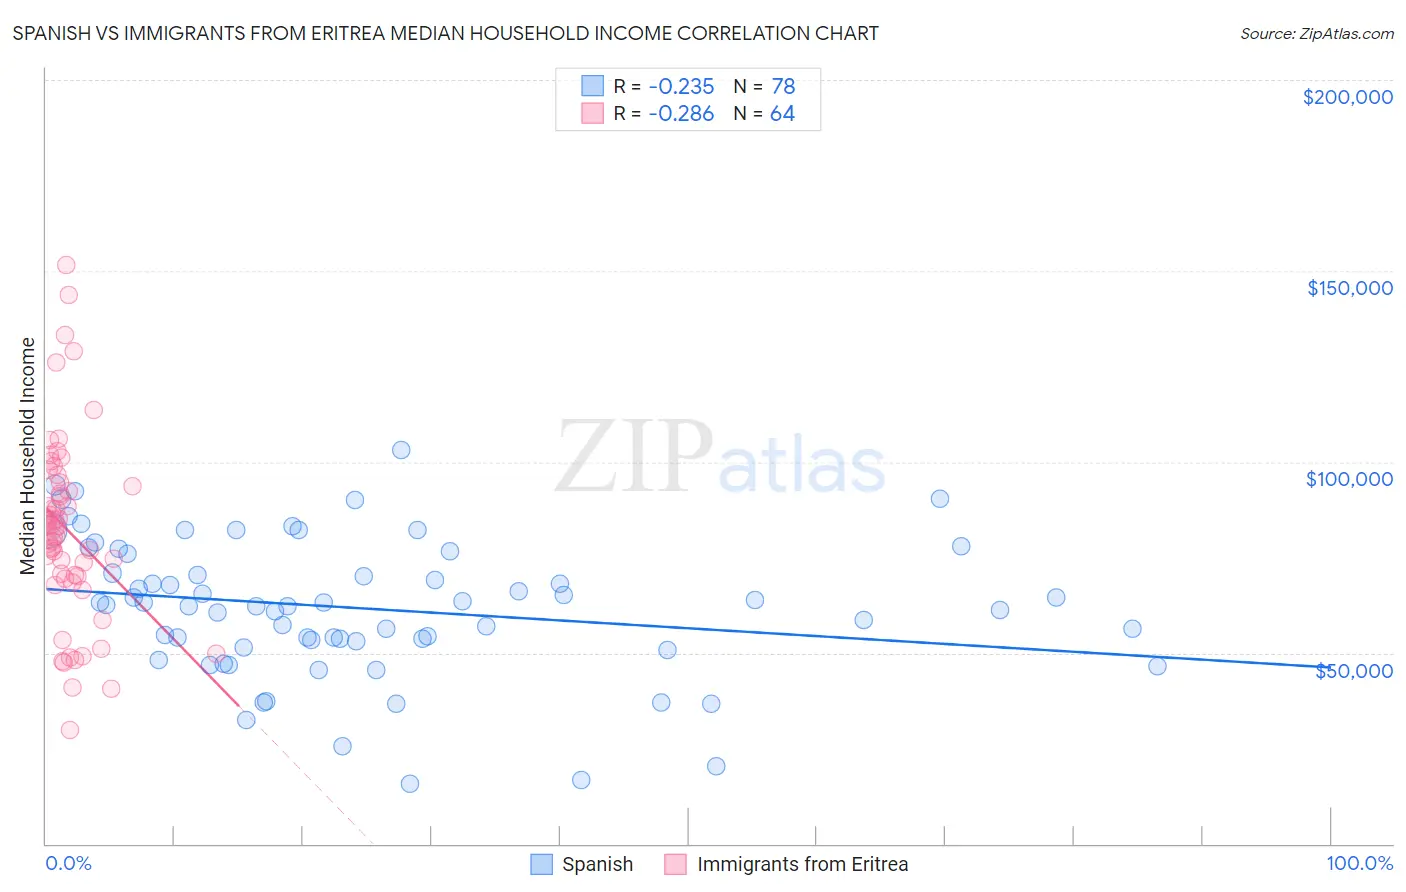
Spanish vs Immigrants from Eritrea Median Household Income Correlation Chart
The statistical analysis conducted on geographies consisting of 421,807,066 people shows a weak negative correlation between the proportion of Spanish and median household income in the United States with a correlation coefficient (R) of -0.235 and weighted average of $83,343. Similarly, the statistical analysis conducted on geographies consisting of 104,846,826 people shows a weak negative correlation between the proportion of Immigrants from Eritrea and median household income in the United States with a correlation coefficient (R) of -0.286 and weighted average of $85,025, a difference of 2.0%.
Median Household Income Correlation Summary
| Measurement | Spanish | Immigrants from Eritrea |
| Minimum | $15,577 | $29,732 |
| Maximum | $103,194 | $151,475 |
| Range | $87,617 | $121,743 |
| Mean | $61,640 | $82,120 |
| Median | $62,411 | $82,729 |
| Interquartile 25% (IQ1) | $53,047 | $69,674 |
| Interquartile 75% (IQ3) | $75,942 | $94,044 |
| Interquartile Range (IQR) | $22,895 | $24,370 |
| Standard Deviation (Sample) | $18,137 | $24,340 |
| Standard Deviation (Population) | $18,021 | $24,149 |
Similar Demographics by Median Household Income
Demographics Similar to Spanish by Median Household Income
In terms of median household income, the demographic groups most similar to Spanish are Tsimshian ($83,346, a difference of 0.0%), German ($83,358, a difference of 0.020%), Immigrants from Thailand ($83,327, a difference of 0.020%), Immigrants from Cambodia ($83,304, a difference of 0.050%), and Japanese ($83,395, a difference of 0.060%).
| Demographics | Rating | Rank | Median Household Income |
| Ghanaians | 27.4 /100 | #194 | Fair $83,582 |
| Immigrants | Armenia | 27.0 /100 | #195 | Fair $83,555 |
| French | 26.0 /100 | #196 | Fair $83,468 |
| Aleuts | 25.7 /100 | #197 | Fair $83,446 |
| Japanese | 25.1 /100 | #198 | Fair $83,395 |
| Germans | 24.6 /100 | #199 | Fair $83,358 |
| Tsimshian | 24.5 /100 | #200 | Fair $83,346 |
| Spanish | 24.4 /100 | #201 | Fair $83,343 |
| Immigrants | Thailand | 24.3 /100 | #202 | Fair $83,327 |
| Immigrants | Cambodia | 24.0 /100 | #203 | Fair $83,304 |
| Immigrants | Africa | 23.8 /100 | #204 | Fair $83,289 |
| Celtics | 22.7 /100 | #205 | Fair $83,193 |
| Immigrants | Kenya | 21.3 /100 | #206 | Fair $83,068 |
| Dutch | 20.3 /100 | #207 | Fair $82,971 |
| French Canadians | 18.7 /100 | #208 | Poor $82,810 |
Demographics Similar to Immigrants from Eritrea by Median Household Income
In terms of median household income, the demographic groups most similar to Immigrants from Eritrea are Immigrants from Costa Rica ($85,054, a difference of 0.030%), Alsatian ($85,053, a difference of 0.030%), Czechoslovakian ($84,965, a difference of 0.070%), Scottish ($85,101, a difference of 0.090%), and English ($84,915, a difference of 0.13%).
| Demographics | Rating | Rank | Median Household Income |
| Swiss | 59.2 /100 | #170 | Average $85,681 |
| Immigrants | South America | 58.1 /100 | #171 | Average $85,611 |
| Slovenes | 57.4 /100 | #172 | Average $85,562 |
| Immigrants | Cameroon | 53.4 /100 | #173 | Average $85,314 |
| Scottish | 50.0 /100 | #174 | Average $85,101 |
| Immigrants | Costa Rica | 49.2 /100 | #175 | Average $85,054 |
| Alsatians | 49.2 /100 | #176 | Average $85,053 |
| Immigrants | Eritrea | 48.8 /100 | #177 | Average $85,025 |
| Czechoslovakians | 47.8 /100 | #178 | Average $84,965 |
| English | 47.0 /100 | #179 | Average $84,915 |
| Immigrants | Portugal | 44.2 /100 | #180 | Average $84,740 |
| Hawaiians | 44.1 /100 | #181 | Average $84,729 |
| Uruguayans | 43.5 /100 | #182 | Average $84,691 |
| Spaniards | 42.7 /100 | #183 | Average $84,644 |
| Immigrants | Eastern Africa | 37.4 /100 | #184 | Fair $84,299 |