African vs Somali Median Male Earnings
COMPARE
African
Somali
Median Male Earnings
Median Male Earnings Comparison
Africans
Somalis
$47,994
MEDIAN MALE EARNINGS
0.2/ 100
METRIC RATING
284th/ 347
METRIC RANK
$49,025
MEDIAN MALE EARNINGS
0.5/ 100
METRIC RATING
266th/ 347
METRIC RANK
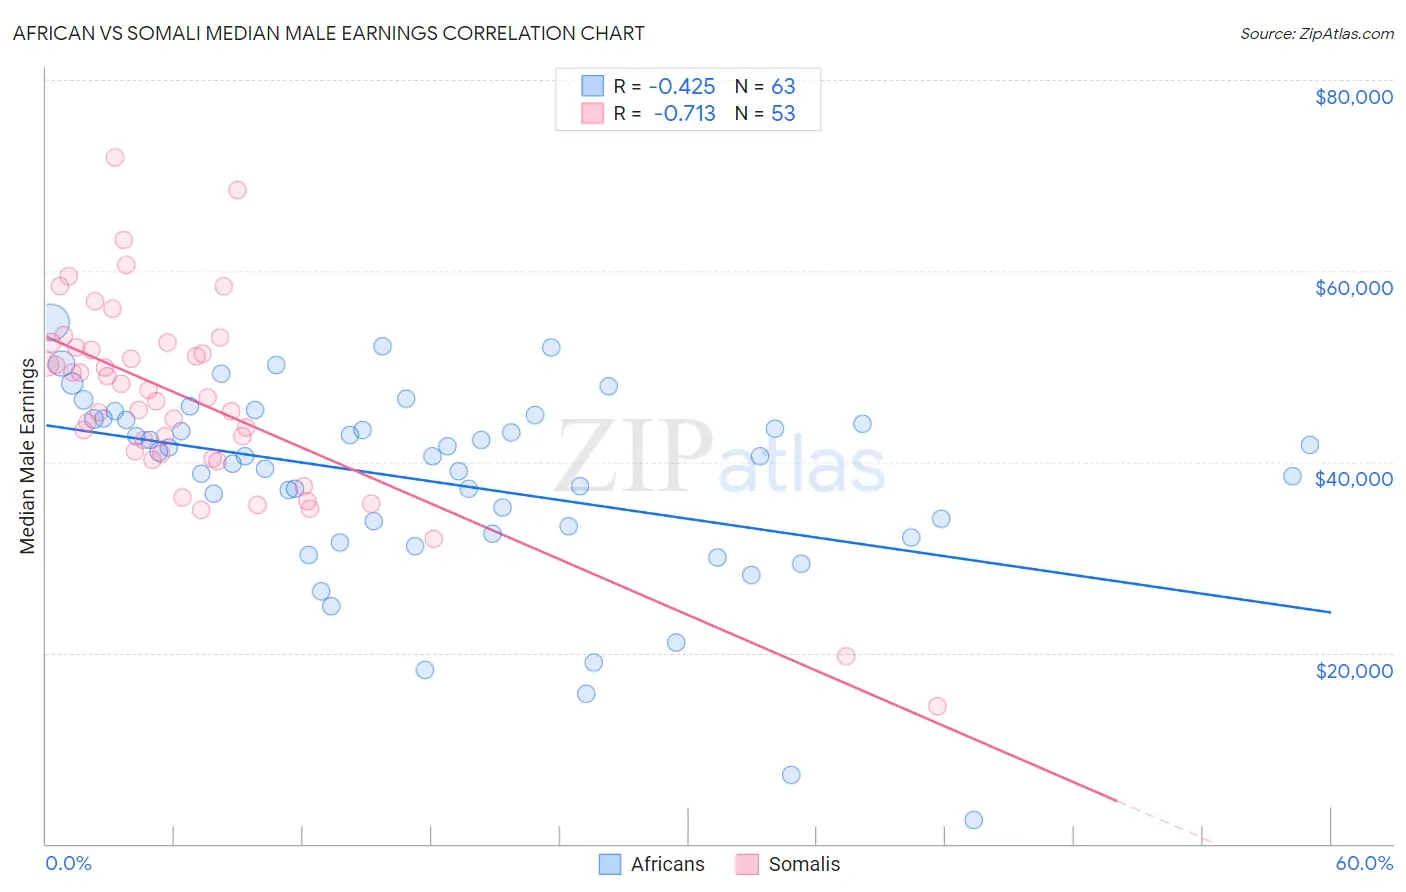
African vs Somali Median Male Earnings Correlation Chart
The statistical analysis conducted on geographies consisting of 469,793,232 people shows a moderate negative correlation between the proportion of Africans and median male earnings in the United States with a correlation coefficient (R) of -0.425 and weighted average of $47,994. Similarly, the statistical analysis conducted on geographies consisting of 99,323,068 people shows a strong negative correlation between the proportion of Somalis and median male earnings in the United States with a correlation coefficient (R) of -0.713 and weighted average of $49,025, a difference of 2.1%.
Median Male Earnings Correlation Summary
| Measurement | African | Somali |
| Minimum | $2,499 | $14,382 |
| Maximum | $54,569 | $71,947 |
| Range | $52,070 | $57,565 |
| Mean | $37,853 | $46,539 |
| Median | $40,627 | $46,803 |
| Interquartile 25% (IQ1) | $32,413 | $40,598 |
| Interquartile 75% (IQ3) | $44,491 | $52,221 |
| Interquartile Range (IQR) | $12,079 | $11,623 |
| Standard Deviation (Sample) | $10,360 | $10,412 |
| Standard Deviation (Population) | $10,278 | $10,313 |
Demographics Similar to Africans and Somalis by Median Male Earnings
In terms of median male earnings, the demographic groups most similar to Africans are Paiute ($47,991, a difference of 0.010%), Immigrants from Jamaica ($48,040, a difference of 0.090%), Central American ($48,093, a difference of 0.21%), Marshallese ($48,137, a difference of 0.30%), and Comanche ($48,202, a difference of 0.43%). Similarly, the demographic groups most similar to Somalis are Spanish American ($49,008, a difference of 0.040%), Ute ($48,899, a difference of 0.26%), Immigrants from Laos ($49,190, a difference of 0.34%), Tsimshian ($48,836, a difference of 0.39%), and Potawatomi ($48,768, a difference of 0.53%).
| Demographics | Rating | Rank | Median Male Earnings |
| Immigrants | Laos | 0.6 /100 | #265 | Tragic $49,190 |
| Somalis | 0.5 /100 | #266 | Tragic $49,025 |
| Spanish Americans | 0.5 /100 | #267 | Tragic $49,008 |
| Ute | 0.4 /100 | #268 | Tragic $48,899 |
| Tsimshian | 0.4 /100 | #269 | Tragic $48,836 |
| Potawatomi | 0.4 /100 | #270 | Tragic $48,768 |
| Cherokee | 0.3 /100 | #271 | Tragic $48,669 |
| Salvadorans | 0.3 /100 | #272 | Tragic $48,646 |
| Jamaicans | 0.3 /100 | #273 | Tragic $48,632 |
| Colville | 0.3 /100 | #274 | Tragic $48,516 |
| Immigrants | Somalia | 0.3 /100 | #275 | Tragic $48,439 |
| Blackfeet | 0.3 /100 | #276 | Tragic $48,402 |
| Belizeans | 0.2 /100 | #277 | Tragic $48,358 |
| Immigrants | Liberia | 0.2 /100 | #278 | Tragic $48,317 |
| Hmong | 0.2 /100 | #279 | Tragic $48,254 |
| Comanche | 0.2 /100 | #280 | Tragic $48,202 |
| Marshallese | 0.2 /100 | #281 | Tragic $48,137 |
| Central Americans | 0.2 /100 | #282 | Tragic $48,093 |
| Immigrants | Jamaica | 0.2 /100 | #283 | Tragic $48,040 |
| Africans | 0.2 /100 | #284 | Tragic $47,994 |
| Paiute | 0.2 /100 | #285 | Tragic $47,991 |