African vs Immigrants from Romania Median Male Earnings
COMPARE
African
Immigrants from Romania
Median Male Earnings
Median Male Earnings Comparison
Africans
Immigrants from Romania
$47,994
MEDIAN MALE EARNINGS
0.2/ 100
METRIC RATING
284th/ 347
METRIC RANK
$61,040
MEDIAN MALE EARNINGS
99.8/ 100
METRIC RATING
62nd/ 347
METRIC RANK
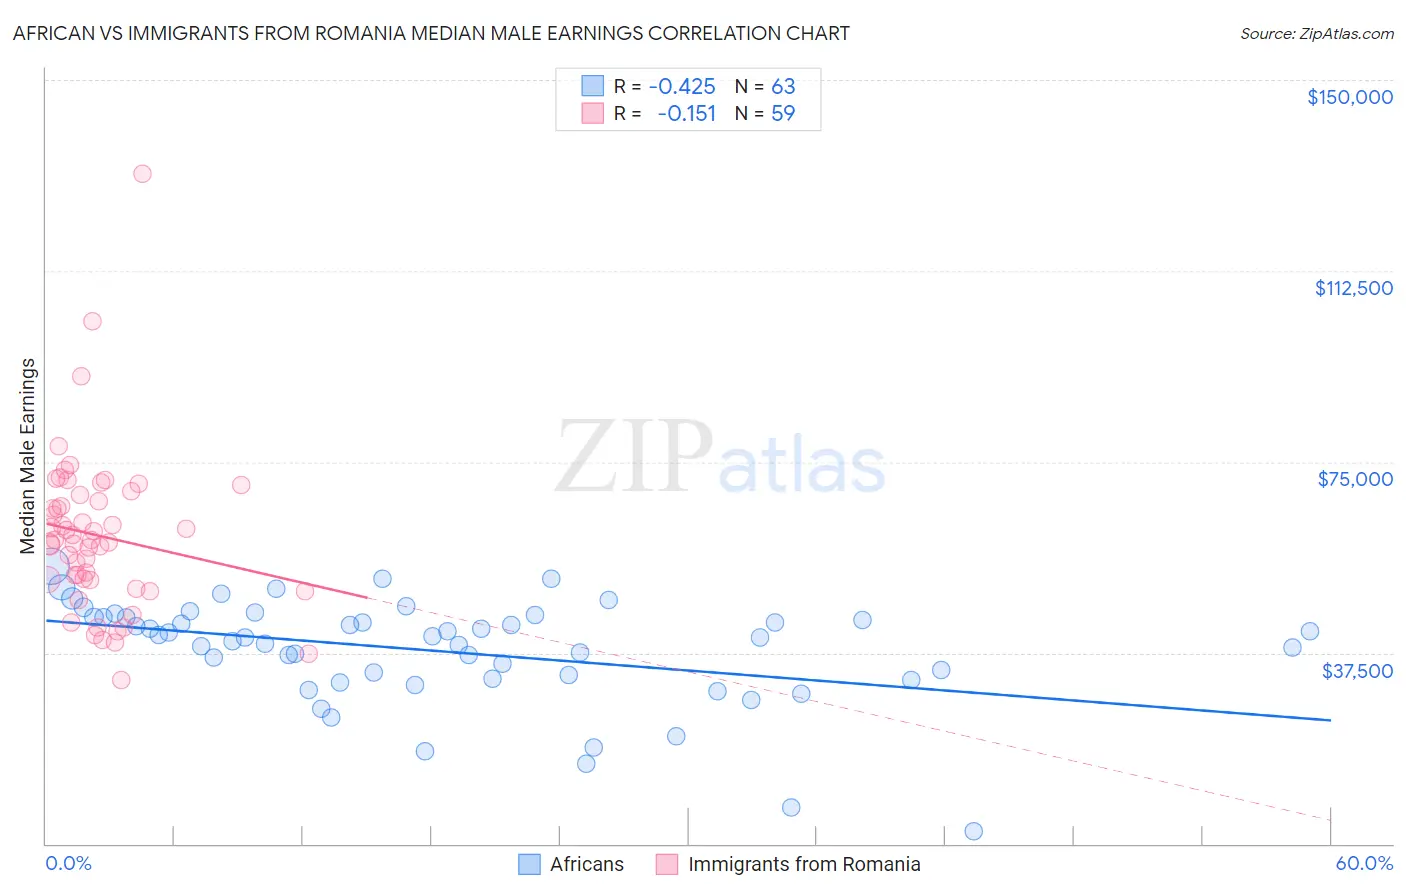
African vs Immigrants from Romania Median Male Earnings Correlation Chart
The statistical analysis conducted on geographies consisting of 469,793,232 people shows a moderate negative correlation between the proportion of Africans and median male earnings in the United States with a correlation coefficient (R) of -0.425 and weighted average of $47,994. Similarly, the statistical analysis conducted on geographies consisting of 256,975,343 people shows a poor negative correlation between the proportion of Immigrants from Romania and median male earnings in the United States with a correlation coefficient (R) of -0.151 and weighted average of $61,040, a difference of 27.2%.
Median Male Earnings Correlation Summary
| Measurement | African | Immigrants from Romania |
| Minimum | $2,499 | $32,206 |
| Maximum | $54,569 | $131,536 |
| Range | $52,070 | $99,330 |
| Mean | $37,853 | $60,508 |
| Median | $40,627 | $59,717 |
| Interquartile 25% (IQ1) | $32,413 | $51,701 |
| Interquartile 75% (IQ3) | $44,491 | $68,594 |
| Interquartile Range (IQR) | $12,079 | $16,893 |
| Standard Deviation (Sample) | $10,360 | $15,927 |
| Standard Deviation (Population) | $10,278 | $15,791 |
Similar Demographics by Median Male Earnings
Demographics Similar to Africans by Median Male Earnings
In terms of median male earnings, the demographic groups most similar to Africans are Paiute ($47,991, a difference of 0.010%), Mexican American Indian ($47,990, a difference of 0.010%), Immigrants from El Salvador ($47,973, a difference of 0.040%), Immigrants from Jamaica ($48,040, a difference of 0.090%), and Shoshone ($47,930, a difference of 0.13%).
| Demographics | Rating | Rank | Median Male Earnings |
| Belizeans | 0.2 /100 | #277 | Tragic $48,358 |
| Immigrants | Liberia | 0.2 /100 | #278 | Tragic $48,317 |
| Hmong | 0.2 /100 | #279 | Tragic $48,254 |
| Comanche | 0.2 /100 | #280 | Tragic $48,202 |
| Marshallese | 0.2 /100 | #281 | Tragic $48,137 |
| Central Americans | 0.2 /100 | #282 | Tragic $48,093 |
| Immigrants | Jamaica | 0.2 /100 | #283 | Tragic $48,040 |
| Africans | 0.2 /100 | #284 | Tragic $47,994 |
| Paiute | 0.2 /100 | #285 | Tragic $47,991 |
| Mexican American Indians | 0.2 /100 | #286 | Tragic $47,990 |
| Immigrants | El Salvador | 0.2 /100 | #287 | Tragic $47,973 |
| Shoshone | 0.2 /100 | #288 | Tragic $47,930 |
| Chickasaw | 0.1 /100 | #289 | Tragic $47,832 |
| Immigrants | Belize | 0.1 /100 | #290 | Tragic $47,809 |
| Choctaw | 0.1 /100 | #291 | Tragic $47,729 |
Demographics Similar to Immigrants from Romania by Median Male Earnings
In terms of median male earnings, the demographic groups most similar to Immigrants from Romania are Bolivian ($61,066, a difference of 0.040%), Immigrants from Netherlands ($61,096, a difference of 0.090%), Egyptian ($61,095, a difference of 0.090%), Immigrants from Pakistan ($60,987, a difference of 0.090%), and Immigrants from Eastern Europe ($60,958, a difference of 0.13%).
| Demographics | Rating | Rank | Median Male Earnings |
| Greeks | 99.9 /100 | #55 | Exceptional $61,242 |
| Lithuanians | 99.9 /100 | #56 | Exceptional $61,228 |
| Immigrants | Scotland | 99.9 /100 | #57 | Exceptional $61,220 |
| New Zealanders | 99.9 /100 | #58 | Exceptional $61,199 |
| Immigrants | Netherlands | 99.8 /100 | #59 | Exceptional $61,096 |
| Egyptians | 99.8 /100 | #60 | Exceptional $61,095 |
| Bolivians | 99.8 /100 | #61 | Exceptional $61,066 |
| Immigrants | Romania | 99.8 /100 | #62 | Exceptional $61,040 |
| Immigrants | Pakistan | 99.8 /100 | #63 | Exceptional $60,987 |
| Immigrants | Eastern Europe | 99.8 /100 | #64 | Exceptional $60,958 |
| Immigrants | Indonesia | 99.8 /100 | #65 | Exceptional $60,935 |
| Immigrants | Croatia | 99.8 /100 | #66 | Exceptional $60,914 |
| Immigrants | Spain | 99.8 /100 | #67 | Exceptional $60,750 |
| Immigrants | Serbia | 99.7 /100 | #68 | Exceptional $60,600 |
| Immigrants | Canada | 99.7 /100 | #69 | Exceptional $60,388 |