African vs Immigrants from Zimbabwe Median Male Earnings
COMPARE
African
Immigrants from Zimbabwe
Median Male Earnings
Median Male Earnings Comparison
Africans
Immigrants from Zimbabwe
$47,994
MEDIAN MALE EARNINGS
0.2/ 100
METRIC RATING
284th/ 347
METRIC RANK
$57,352
MEDIAN MALE EARNINGS
94.3/ 100
METRIC RATING
117th/ 347
METRIC RANK
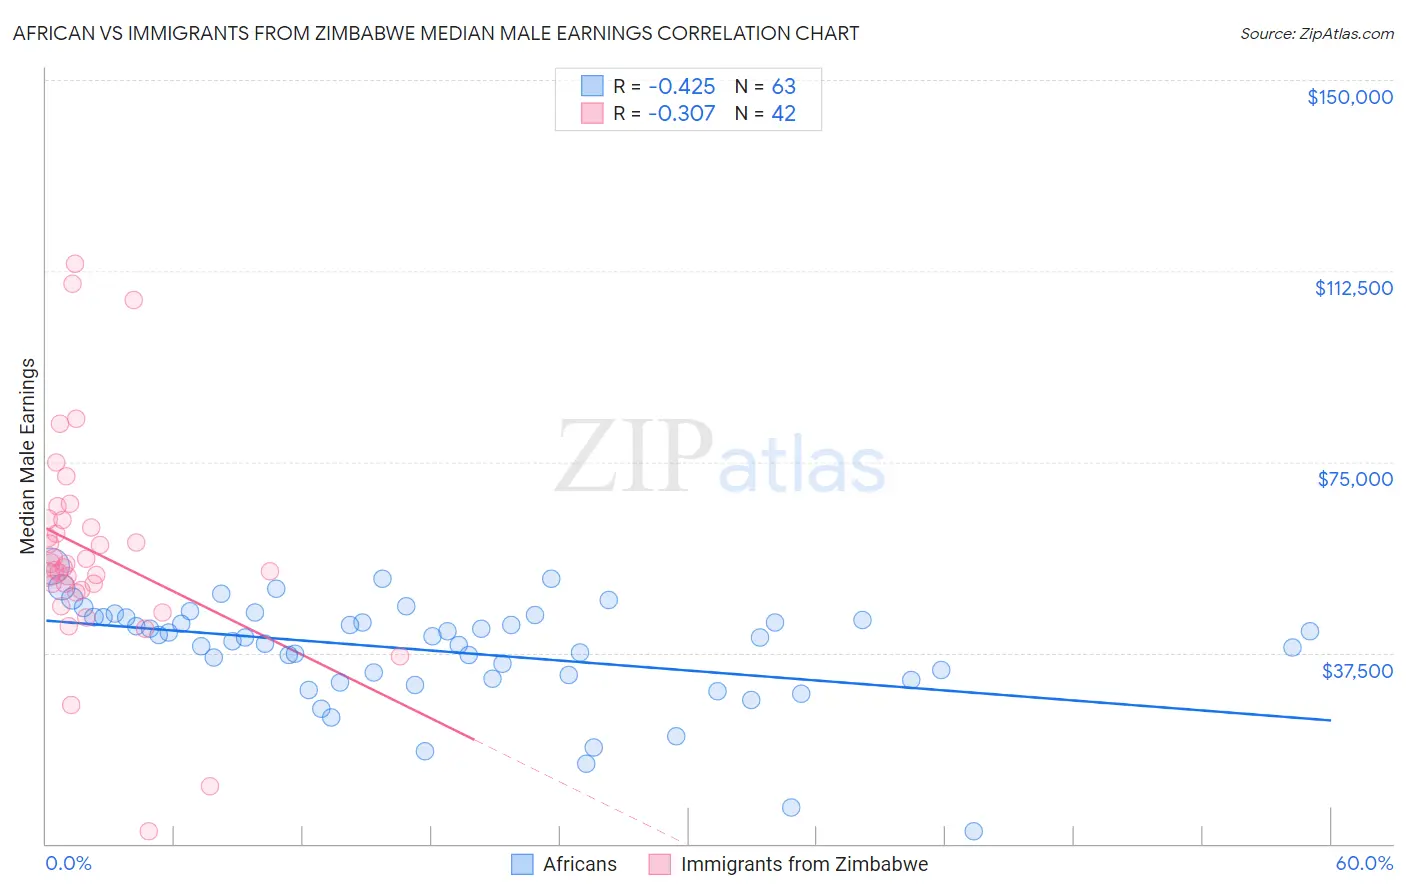
African vs Immigrants from Zimbabwe Median Male Earnings Correlation Chart
The statistical analysis conducted on geographies consisting of 469,793,232 people shows a moderate negative correlation between the proportion of Africans and median male earnings in the United States with a correlation coefficient (R) of -0.425 and weighted average of $47,994. Similarly, the statistical analysis conducted on geographies consisting of 117,801,711 people shows a mild negative correlation between the proportion of Immigrants from Zimbabwe and median male earnings in the United States with a correlation coefficient (R) of -0.307 and weighted average of $57,352, a difference of 19.5%.
Median Male Earnings Correlation Summary
| Measurement | African | Immigrants from Zimbabwe |
| Minimum | $2,499 | $2,499 |
| Maximum | $54,569 | $113,981 |
| Range | $52,070 | $111,482 |
| Mean | $37,853 | $57,395 |
| Median | $40,627 | $54,601 |
| Interquartile 25% (IQ1) | $32,413 | $49,751 |
| Interquartile 75% (IQ3) | $44,491 | $63,542 |
| Interquartile Range (IQR) | $12,079 | $13,791 |
| Standard Deviation (Sample) | $10,360 | $21,107 |
| Standard Deviation (Population) | $10,278 | $20,855 |
Similar Demographics by Median Male Earnings
Demographics Similar to Africans by Median Male Earnings
In terms of median male earnings, the demographic groups most similar to Africans are Paiute ($47,991, a difference of 0.010%), Mexican American Indian ($47,990, a difference of 0.010%), Immigrants from El Salvador ($47,973, a difference of 0.040%), Immigrants from Jamaica ($48,040, a difference of 0.090%), and Shoshone ($47,930, a difference of 0.13%).
| Demographics | Rating | Rank | Median Male Earnings |
| Belizeans | 0.2 /100 | #277 | Tragic $48,358 |
| Immigrants | Liberia | 0.2 /100 | #278 | Tragic $48,317 |
| Hmong | 0.2 /100 | #279 | Tragic $48,254 |
| Comanche | 0.2 /100 | #280 | Tragic $48,202 |
| Marshallese | 0.2 /100 | #281 | Tragic $48,137 |
| Central Americans | 0.2 /100 | #282 | Tragic $48,093 |
| Immigrants | Jamaica | 0.2 /100 | #283 | Tragic $48,040 |
| Africans | 0.2 /100 | #284 | Tragic $47,994 |
| Paiute | 0.2 /100 | #285 | Tragic $47,991 |
| Mexican American Indians | 0.2 /100 | #286 | Tragic $47,990 |
| Immigrants | El Salvador | 0.2 /100 | #287 | Tragic $47,973 |
| Shoshone | 0.2 /100 | #288 | Tragic $47,930 |
| Chickasaw | 0.1 /100 | #289 | Tragic $47,832 |
| Immigrants | Belize | 0.1 /100 | #290 | Tragic $47,809 |
| Choctaw | 0.1 /100 | #291 | Tragic $47,729 |
Demographics Similar to Immigrants from Zimbabwe by Median Male Earnings
In terms of median male earnings, the demographic groups most similar to Immigrants from Zimbabwe are Hungarian ($57,309, a difference of 0.080%), Arab ($57,298, a difference of 0.090%), Lebanese ($57,409, a difference of 0.10%), Canadian ($57,286, a difference of 0.12%), and Swedish ($57,445, a difference of 0.16%).
| Demographics | Rating | Rank | Median Male Earnings |
| Palestinians | 96.2 /100 | #110 | Exceptional $57,778 |
| Europeans | 95.6 /100 | #111 | Exceptional $57,637 |
| Immigrants | Afghanistan | 95.4 /100 | #112 | Exceptional $57,582 |
| Carpatho Rusyns | 95.3 /100 | #113 | Exceptional $57,572 |
| Immigrants | Kuwait | 95.3 /100 | #114 | Exceptional $57,562 |
| Swedes | 94.8 /100 | #115 | Exceptional $57,445 |
| Lebanese | 94.6 /100 | #116 | Exceptional $57,409 |
| Immigrants | Zimbabwe | 94.3 /100 | #117 | Exceptional $57,352 |
| Hungarians | 94.0 /100 | #118 | Exceptional $57,309 |
| Arabs | 94.0 /100 | #119 | Exceptional $57,298 |
| Canadians | 93.9 /100 | #120 | Exceptional $57,286 |
| Immigrants | Albania | 93.3 /100 | #121 | Exceptional $57,179 |
| Immigrants | Jordan | 93.1 /100 | #122 | Exceptional $57,145 |
| Slovenes | 93.1 /100 | #123 | Exceptional $57,145 |
| Chileans | 91.9 /100 | #124 | Exceptional $56,973 |