African vs Immigrants from Latvia Median Male Earnings
COMPARE
African
Immigrants from Latvia
Median Male Earnings
Median Male Earnings Comparison
Africans
Immigrants from Latvia
$47,994
MEDIAN MALE EARNINGS
0.2/ 100
METRIC RATING
284th/ 347
METRIC RANK
$61,422
MEDIAN MALE EARNINGS
99.9/ 100
METRIC RATING
54th/ 347
METRIC RANK
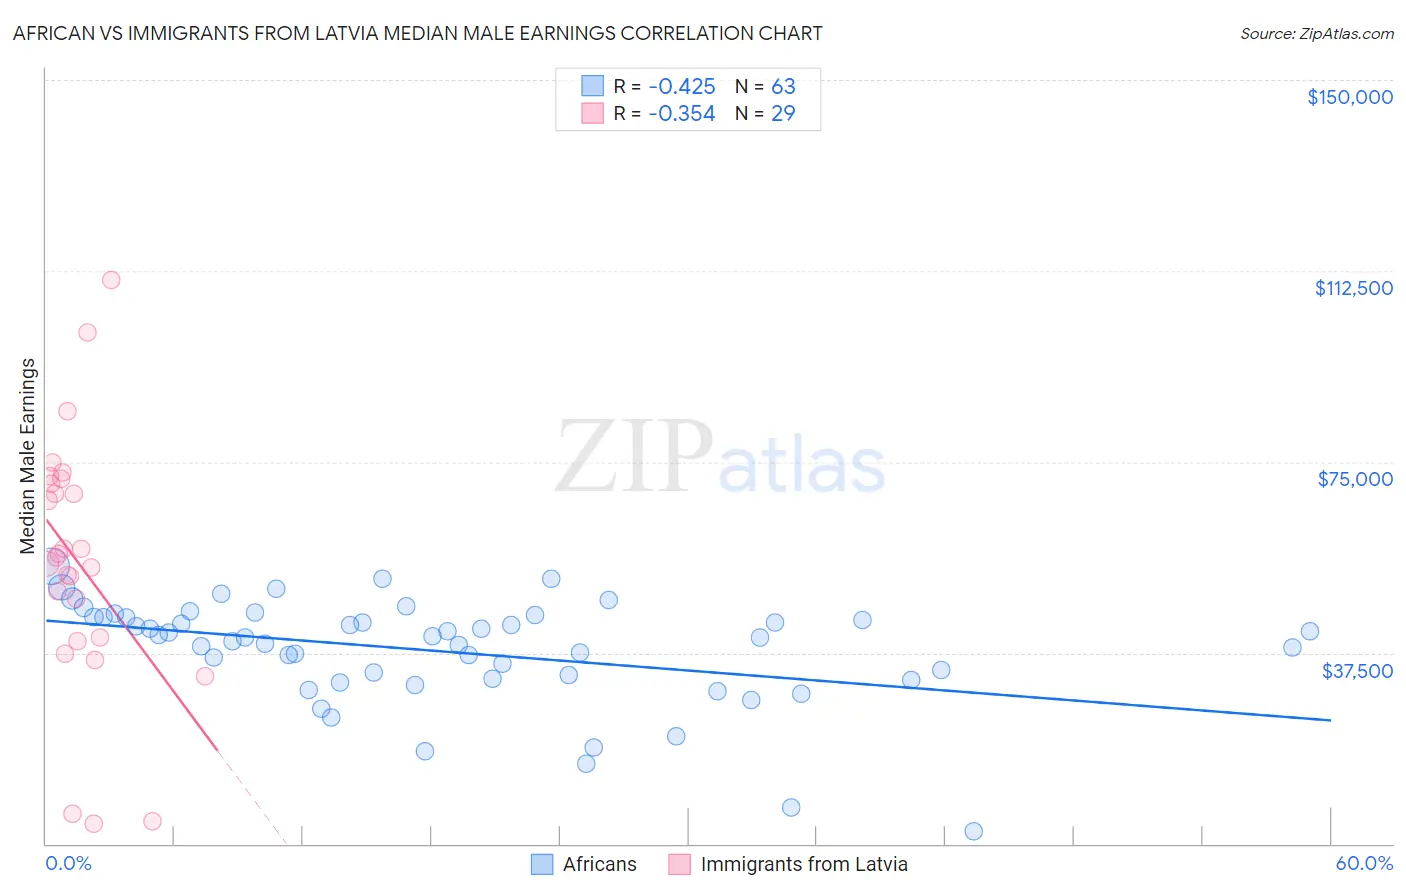
African vs Immigrants from Latvia Median Male Earnings Correlation Chart
The statistical analysis conducted on geographies consisting of 469,793,232 people shows a moderate negative correlation between the proportion of Africans and median male earnings in the United States with a correlation coefficient (R) of -0.425 and weighted average of $47,994. Similarly, the statistical analysis conducted on geographies consisting of 113,724,849 people shows a mild negative correlation between the proportion of Immigrants from Latvia and median male earnings in the United States with a correlation coefficient (R) of -0.354 and weighted average of $61,422, a difference of 28.0%.
Median Male Earnings Correlation Summary
| Measurement | African | Immigrants from Latvia |
| Minimum | $2,499 | $3,900 |
| Maximum | $54,569 | $110,833 |
| Range | $52,070 | $106,933 |
| Mean | $37,853 | $55,354 |
| Median | $40,627 | $56,127 |
| Interquartile 25% (IQ1) | $32,413 | $40,143 |
| Interquartile 75% (IQ3) | $44,491 | $71,183 |
| Interquartile Range (IQR) | $12,079 | $31,039 |
| Standard Deviation (Sample) | $10,360 | $24,947 |
| Standard Deviation (Population) | $10,278 | $24,513 |
Similar Demographics by Median Male Earnings
Demographics Similar to Africans by Median Male Earnings
In terms of median male earnings, the demographic groups most similar to Africans are Paiute ($47,991, a difference of 0.010%), Mexican American Indian ($47,990, a difference of 0.010%), Immigrants from El Salvador ($47,973, a difference of 0.040%), Immigrants from Jamaica ($48,040, a difference of 0.090%), and Shoshone ($47,930, a difference of 0.13%).
| Demographics | Rating | Rank | Median Male Earnings |
| Belizeans | 0.2 /100 | #277 | Tragic $48,358 |
| Immigrants | Liberia | 0.2 /100 | #278 | Tragic $48,317 |
| Hmong | 0.2 /100 | #279 | Tragic $48,254 |
| Comanche | 0.2 /100 | #280 | Tragic $48,202 |
| Marshallese | 0.2 /100 | #281 | Tragic $48,137 |
| Central Americans | 0.2 /100 | #282 | Tragic $48,093 |
| Immigrants | Jamaica | 0.2 /100 | #283 | Tragic $48,040 |
| Africans | 0.2 /100 | #284 | Tragic $47,994 |
| Paiute | 0.2 /100 | #285 | Tragic $47,991 |
| Mexican American Indians | 0.2 /100 | #286 | Tragic $47,990 |
| Immigrants | El Salvador | 0.2 /100 | #287 | Tragic $47,973 |
| Shoshone | 0.2 /100 | #288 | Tragic $47,930 |
| Chickasaw | 0.1 /100 | #289 | Tragic $47,832 |
| Immigrants | Belize | 0.1 /100 | #290 | Tragic $47,809 |
| Choctaw | 0.1 /100 | #291 | Tragic $47,729 |
Demographics Similar to Immigrants from Latvia by Median Male Earnings
In terms of median male earnings, the demographic groups most similar to Immigrants from Latvia are South African ($61,460, a difference of 0.060%), Greek ($61,242, a difference of 0.29%), Lithuanian ($61,228, a difference of 0.32%), Immigrants from Scotland ($61,220, a difference of 0.33%), and Immigrants from Norway ($61,628, a difference of 0.34%).
| Demographics | Rating | Rank | Median Male Earnings |
| Immigrants | Austria | 99.9 /100 | #47 | Exceptional $62,164 |
| Immigrants | Malaysia | 99.9 /100 | #48 | Exceptional $62,121 |
| Immigrants | Europe | 99.9 /100 | #49 | Exceptional $62,057 |
| Bhutanese | 99.9 /100 | #50 | Exceptional $61,759 |
| Estonians | 99.9 /100 | #51 | Exceptional $61,710 |
| Immigrants | Norway | 99.9 /100 | #52 | Exceptional $61,628 |
| South Africans | 99.9 /100 | #53 | Exceptional $61,460 |
| Immigrants | Latvia | 99.9 /100 | #54 | Exceptional $61,422 |
| Greeks | 99.9 /100 | #55 | Exceptional $61,242 |
| Lithuanians | 99.9 /100 | #56 | Exceptional $61,228 |
| Immigrants | Scotland | 99.9 /100 | #57 | Exceptional $61,220 |
| New Zealanders | 99.9 /100 | #58 | Exceptional $61,199 |
| Immigrants | Netherlands | 99.8 /100 | #59 | Exceptional $61,096 |
| Egyptians | 99.8 /100 | #60 | Exceptional $61,095 |
| Bolivians | 99.8 /100 | #61 | Exceptional $61,066 |