African vs Cree 10th Grade
COMPARE
African
Cree
10th Grade
10th Grade Comparison
Africans
Cree
93.1%
10TH GRADE
4.6/ 100
METRIC RATING
235th/ 347
METRIC RANK
94.4%
10TH GRADE
95.1/ 100
METRIC RATING
123rd/ 347
METRIC RANK
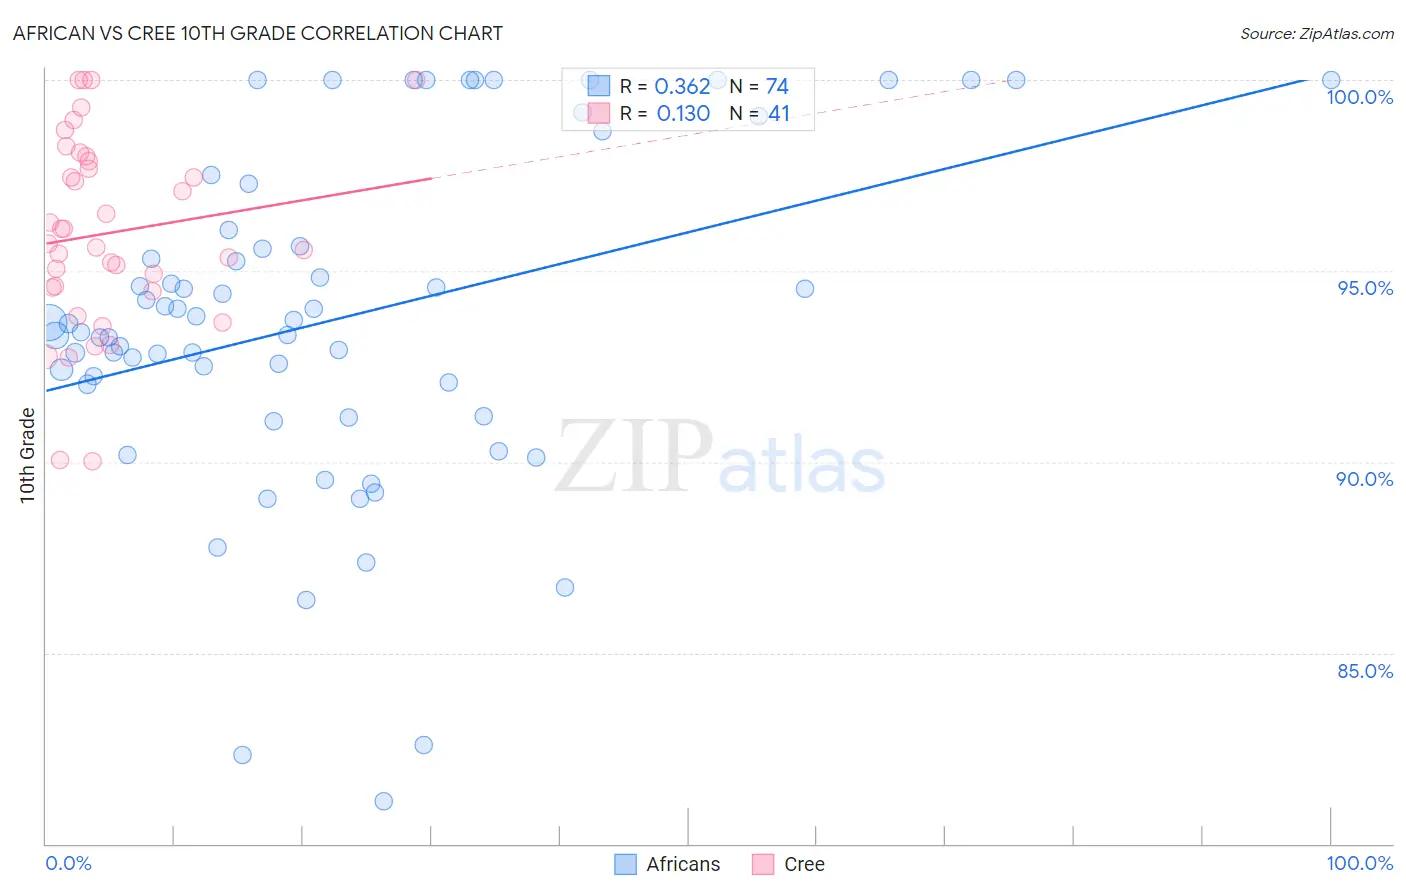
African vs Cree 10th Grade Correlation Chart
The statistical analysis conducted on geographies consisting of 470,094,658 people shows a mild positive correlation between the proportion of Africans and percentage of population with at least 10th grade education in the United States with a correlation coefficient (R) of 0.362 and weighted average of 93.1%. Similarly, the statistical analysis conducted on geographies consisting of 76,211,744 people shows a poor positive correlation between the proportion of Cree and percentage of population with at least 10th grade education in the United States with a correlation coefficient (R) of 0.130 and weighted average of 94.4%, a difference of 1.3%.
10th Grade Correlation Summary
| Measurement | African | Cree |
| Minimum | 81.1% | 90.0% |
| Maximum | 100.0% | 100.0% |
| Range | 18.9% | 10.0% |
| Mean | 93.8% | 96.0% |
| Median | 93.6% | 95.7% |
| Interquartile 25% (IQ1) | 92.0% | 94.5% |
| Interquartile 75% (IQ3) | 96.1% | 97.9% |
| Interquartile Range (IQR) | 4.0% | 3.4% |
| Standard Deviation (Sample) | 4.4% | 2.5% |
| Standard Deviation (Population) | 4.4% | 2.5% |
Similar Demographics by 10th Grade
Demographics Similar to Africans by 10th Grade
In terms of 10th grade, the demographic groups most similar to Africans are Afghan (93.1%, a difference of 0.0%), South American Indian (93.1%, a difference of 0.010%), Bahamian (93.1%, a difference of 0.010%), Comanche (93.1%, a difference of 0.010%), and Subsaharan African (93.1%, a difference of 0.010%).
| Demographics | Rating | Rank | 10th Grade |
| Immigrants | China | 5.9 /100 | #228 | Tragic 93.2% |
| Immigrants | Ethiopia | 5.1 /100 | #229 | Tragic 93.1% |
| Immigrants | Africa | 5.0 /100 | #230 | Tragic 93.1% |
| South American Indians | 4.9 /100 | #231 | Tragic 93.1% |
| Bahamians | 4.9 /100 | #232 | Tragic 93.1% |
| Comanche | 4.9 /100 | #233 | Tragic 93.1% |
| Sub-Saharan Africans | 4.7 /100 | #234 | Tragic 93.1% |
| Africans | 4.6 /100 | #235 | Tragic 93.1% |
| Afghans | 4.5 /100 | #236 | Tragic 93.1% |
| Immigrants | Panama | 4.3 /100 | #237 | Tragic 93.1% |
| Nigerians | 4.2 /100 | #238 | Tragic 93.1% |
| Costa Ricans | 4.2 /100 | #239 | Tragic 93.1% |
| Immigrants | Hong Kong | 4.2 /100 | #240 | Tragic 93.1% |
| Immigrants | Somalia | 2.7 /100 | #241 | Tragic 93.0% |
| Immigrants | Cameroon | 2.6 /100 | #242 | Tragic 93.0% |
Demographics Similar to Cree by 10th Grade
In terms of 10th grade, the demographic groups most similar to Cree are Immigrants from Belarus (94.4%, a difference of 0.0%), Inupiat (94.4%, a difference of 0.0%), Immigrants from Taiwan (94.4%, a difference of 0.010%), Basque (94.3%, a difference of 0.010%), and Jordanian (94.4%, a difference of 0.020%).
| Demographics | Rating | Rank | 10th Grade |
| Sioux | 96.2 /100 | #116 | Exceptional 94.4% |
| Immigrants | Hungary | 95.8 /100 | #117 | Exceptional 94.4% |
| Jordanians | 95.6 /100 | #118 | Exceptional 94.4% |
| Immigrants | Israel | 95.4 /100 | #119 | Exceptional 94.4% |
| Immigrants | Taiwan | 95.3 /100 | #120 | Exceptional 94.4% |
| Immigrants | Belarus | 95.2 /100 | #121 | Exceptional 94.4% |
| Inupiat | 95.1 /100 | #122 | Exceptional 94.4% |
| Cree | 95.1 /100 | #123 | Exceptional 94.4% |
| Basques | 94.9 /100 | #124 | Exceptional 94.3% |
| Americans | 94.4 /100 | #125 | Exceptional 94.3% |
| Immigrants | Iran | 94.4 /100 | #126 | Exceptional 94.3% |
| Israelis | 93.8 /100 | #127 | Exceptional 94.3% |
| Potawatomi | 93.6 /100 | #128 | Exceptional 94.3% |
| Iroquois | 92.8 /100 | #129 | Exceptional 94.3% |
| Immigrants | Greece | 92.7 /100 | #130 | Exceptional 94.3% |