Guyanese vs Cree Median Household Income
COMPARE
Guyanese
Cree
Median Household Income
Median Household Income Comparison
Guyanese
Cree
$80,734
MEDIAN HOUSEHOLD INCOME
5.7/ 100
METRIC RATING
227th/ 347
METRIC RANK
$74,685
MEDIAN HOUSEHOLD INCOME
0.1/ 100
METRIC RATING
283rd/ 347
METRIC RANK
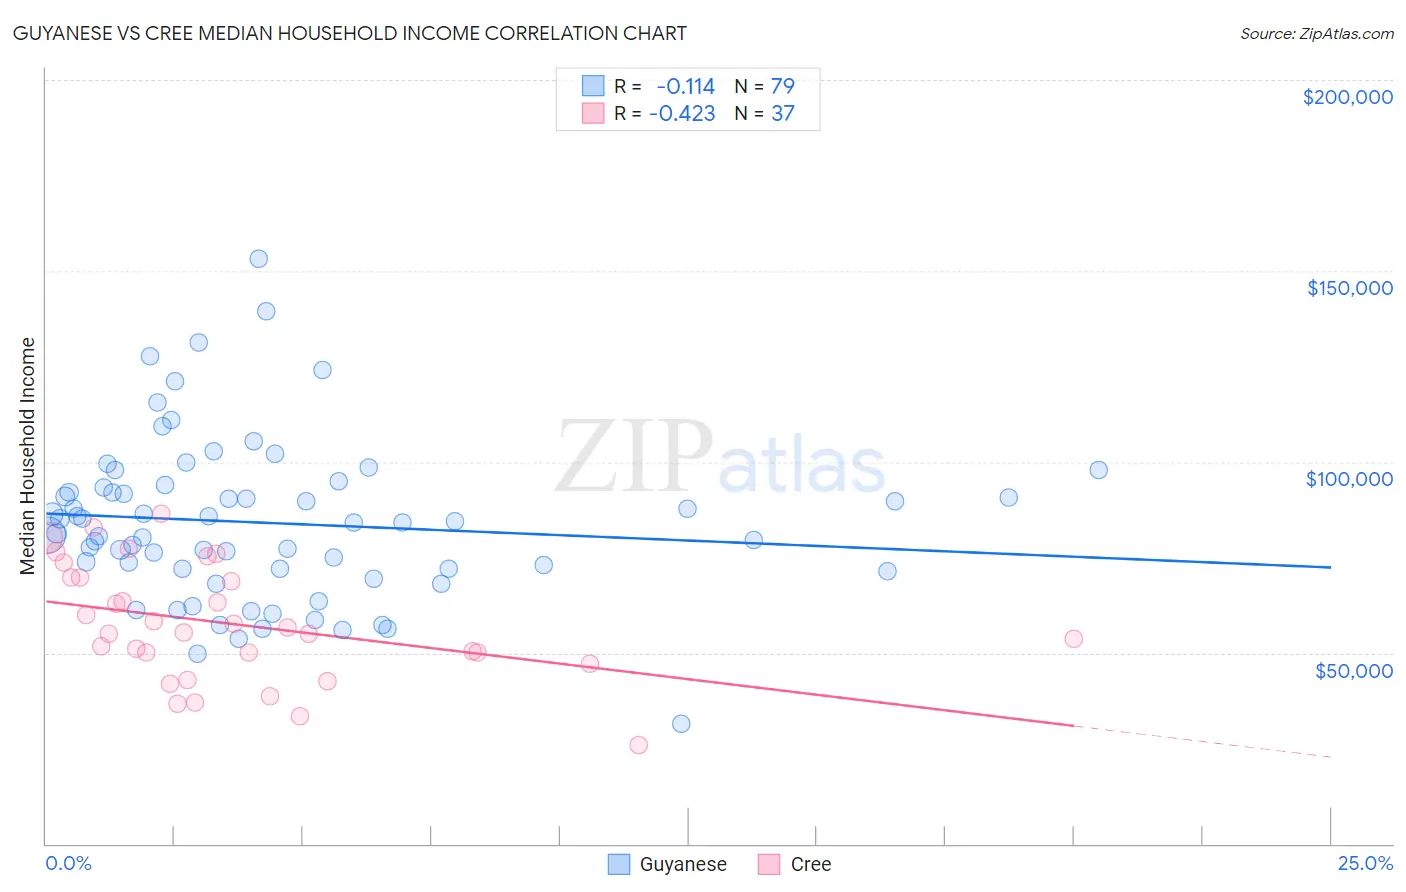
Guyanese vs Cree Median Household Income Correlation Chart
The statistical analysis conducted on geographies consisting of 176,770,411 people shows a poor negative correlation between the proportion of Guyanese and median household income in the United States with a correlation coefficient (R) of -0.114 and weighted average of $80,734. Similarly, the statistical analysis conducted on geographies consisting of 76,206,119 people shows a moderate negative correlation between the proportion of Cree and median household income in the United States with a correlation coefficient (R) of -0.423 and weighted average of $74,685, a difference of 8.1%.
Median Household Income Correlation Summary
| Measurement | Guyanese | Cree |
| Minimum | $31,571 | $25,833 |
| Maximum | $153,152 | $86,509 |
| Range | $121,581 | $60,676 |
| Mean | $83,976 | $57,468 |
| Median | $84,085 | $55,368 |
| Interquartile 25% (IQ1) | $71,864 | $48,609 |
| Interquartile 75% (IQ3) | $93,235 | $69,690 |
| Interquartile Range (IQR) | $21,371 | $21,081 |
| Standard Deviation (Sample) | $21,109 | $14,992 |
| Standard Deviation (Population) | $20,975 | $14,788 |
Similar Demographics by Median Household Income
Demographics Similar to Guyanese by Median Household Income
In terms of median household income, the demographic groups most similar to Guyanese are Immigrants from Bangladesh ($80,722, a difference of 0.010%), Immigrants from Panama ($80,873, a difference of 0.17%), Delaware ($80,527, a difference of 0.26%), Scotch-Irish ($80,972, a difference of 0.29%), and Malaysian ($81,064, a difference of 0.41%).
| Demographics | Rating | Rank | Median Household Income |
| Immigrants | Venezuela | 9.0 /100 | #220 | Tragic $81,506 |
| Immigrants | Ghana | 9.0 /100 | #221 | Tragic $81,489 |
| Immigrants | Nigeria | 7.7 /100 | #222 | Tragic $81,236 |
| Immigrants | El Salvador | 7.6 /100 | #223 | Tragic $81,213 |
| Malaysians | 7.0 /100 | #224 | Tragic $81,064 |
| Scotch-Irish | 6.6 /100 | #225 | Tragic $80,972 |
| Immigrants | Panama | 6.2 /100 | #226 | Tragic $80,873 |
| Guyanese | 5.7 /100 | #227 | Tragic $80,734 |
| Immigrants | Bangladesh | 5.7 /100 | #228 | Tragic $80,722 |
| Delaware | 5.0 /100 | #229 | Tragic $80,527 |
| Bermudans | 4.7 /100 | #230 | Tragic $80,406 |
| Trinidadians and Tobagonians | 4.7 /100 | #231 | Tragic $80,402 |
| Immigrants | Trinidad and Tobago | 4.6 /100 | #232 | Tragic $80,373 |
| Immigrants | Azores | 4.5 /100 | #233 | Tragic $80,357 |
| Immigrants | Ecuador | 4.5 /100 | #234 | Tragic $80,341 |
Demographics Similar to Cree by Median Household Income
In terms of median household income, the demographic groups most similar to Cree are Yaqui ($74,596, a difference of 0.12%), Central American Indian ($74,847, a difference of 0.22%), Immigrants from Liberia ($74,896, a difference of 0.28%), Mexican ($74,399, a difference of 0.39%), and Senegalese ($74,999, a difference of 0.42%).
| Demographics | Rating | Rank | Median Household Income |
| Immigrants | Latin America | 0.2 /100 | #276 | Tragic $75,420 |
| Spanish Americans | 0.2 /100 | #277 | Tragic $75,386 |
| Osage | 0.2 /100 | #278 | Tragic $75,240 |
| Immigrants | Guatemala | 0.2 /100 | #279 | Tragic $75,123 |
| Senegalese | 0.2 /100 | #280 | Tragic $74,999 |
| Immigrants | Liberia | 0.1 /100 | #281 | Tragic $74,896 |
| Central American Indians | 0.1 /100 | #282 | Tragic $74,847 |
| Cree | 0.1 /100 | #283 | Tragic $74,685 |
| Yaqui | 0.1 /100 | #284 | Tragic $74,596 |
| Mexicans | 0.1 /100 | #285 | Tragic $74,399 |
| Immigrants | Somalia | 0.1 /100 | #286 | Tragic $74,300 |
| Iroquois | 0.1 /100 | #287 | Tragic $74,279 |
| Immigrants | Central America | 0.1 /100 | #288 | Tragic $74,217 |
| Fijians | 0.1 /100 | #289 | Tragic $74,205 |
| Bangladeshis | 0.1 /100 | #290 | Tragic $74,112 |