Austrian vs Cree Median Household Income
COMPARE
Austrian
Cree
Median Household Income
Median Household Income Comparison
Austrians
Cree
$91,339
MEDIAN HOUSEHOLD INCOME
98.2/ 100
METRIC RATING
102nd/ 347
METRIC RANK
$74,685
MEDIAN HOUSEHOLD INCOME
0.1/ 100
METRIC RATING
283rd/ 347
METRIC RANK
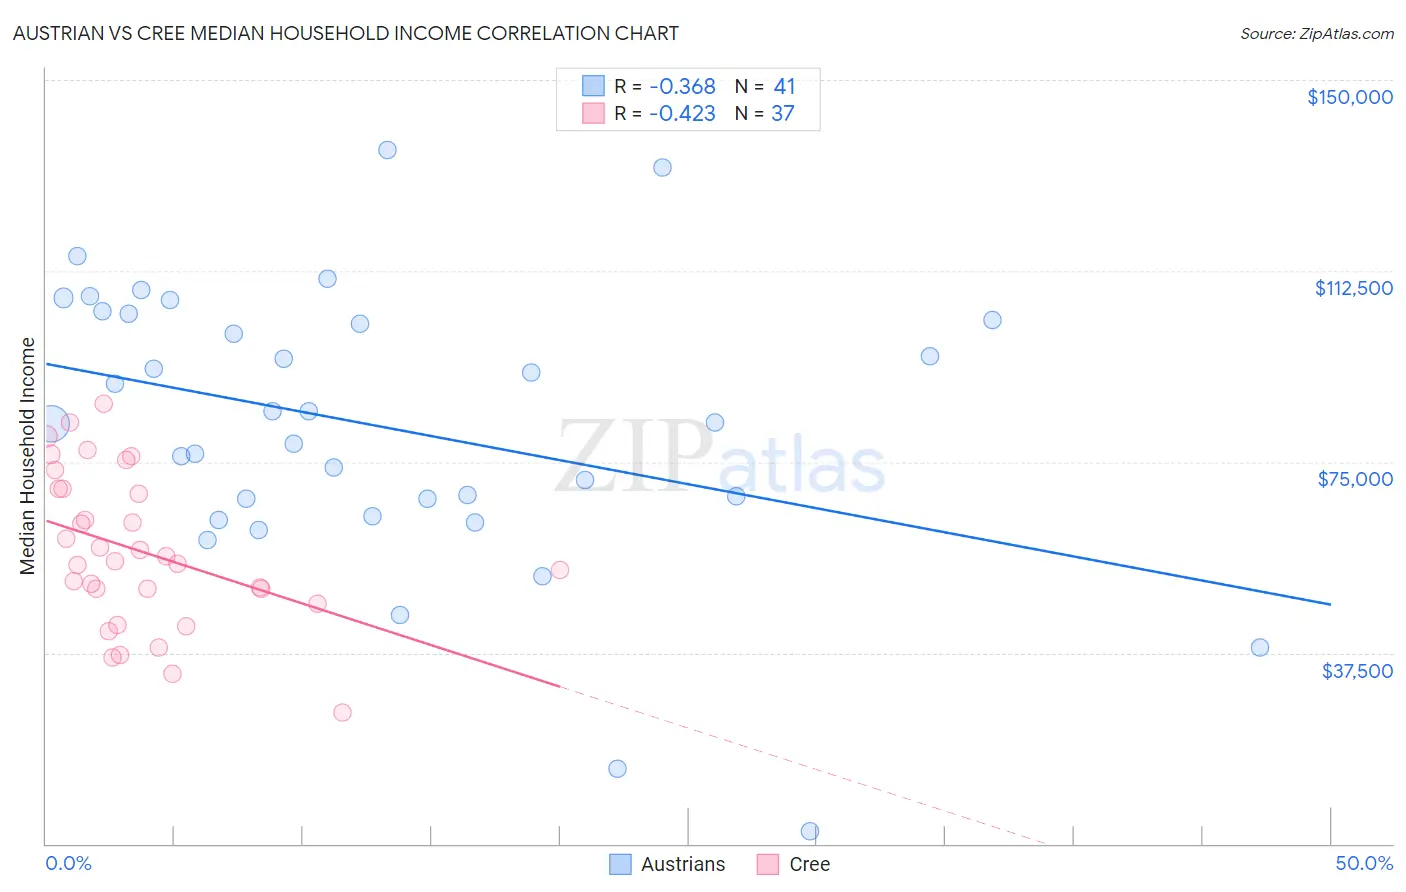
Austrian vs Cree Median Household Income Correlation Chart
The statistical analysis conducted on geographies consisting of 451,682,607 people shows a mild negative correlation between the proportion of Austrians and median household income in the United States with a correlation coefficient (R) of -0.368 and weighted average of $91,339. Similarly, the statistical analysis conducted on geographies consisting of 76,206,119 people shows a moderate negative correlation between the proportion of Cree and median household income in the United States with a correlation coefficient (R) of -0.423 and weighted average of $74,685, a difference of 22.3%.
Median Household Income Correlation Summary
| Measurement | Austrian | Cree |
| Minimum | $2,499 | $25,833 |
| Maximum | $136,149 | $86,509 |
| Range | $133,650 | $60,676 |
| Mean | $81,843 | $57,468 |
| Median | $82,650 | $55,368 |
| Interquartile 25% (IQ1) | $65,934 | $48,609 |
| Interquartile 75% (IQ3) | $103,488 | $69,690 |
| Interquartile Range (IQR) | $37,555 | $21,081 |
| Standard Deviation (Sample) | $27,786 | $14,992 |
| Standard Deviation (Population) | $27,445 | $14,788 |
Similar Demographics by Median Household Income
Demographics Similar to Austrians by Median Household Income
In terms of median household income, the demographic groups most similar to Austrians are Immigrants from Moldova ($91,446, a difference of 0.12%), Ukrainian ($91,456, a difference of 0.13%), Immigrants from South Eastern Asia ($91,541, a difference of 0.22%), Immigrants from Ukraine ($91,124, a difference of 0.24%), and Immigrants from Southern Europe ($91,605, a difference of 0.29%).
| Demographics | Rating | Rank | Median Household Income |
| Armenians | 98.7 /100 | #95 | Exceptional $91,807 |
| Jordanians | 98.7 /100 | #96 | Exceptional $91,794 |
| Immigrants | Serbia | 98.6 /100 | #97 | Exceptional $91,730 |
| Immigrants | Southern Europe | 98.5 /100 | #98 | Exceptional $91,605 |
| Immigrants | South Eastern Asia | 98.4 /100 | #99 | Exceptional $91,541 |
| Ukrainians | 98.3 /100 | #100 | Exceptional $91,456 |
| Immigrants | Moldova | 98.3 /100 | #101 | Exceptional $91,446 |
| Austrians | 98.2 /100 | #102 | Exceptional $91,339 |
| Immigrants | Ukraine | 98.0 /100 | #103 | Exceptional $91,124 |
| Immigrants | Kazakhstan | 97.8 /100 | #104 | Exceptional $91,015 |
| Immigrants | Brazil | 97.7 /100 | #105 | Exceptional $90,907 |
| Macedonians | 97.4 /100 | #106 | Exceptional $90,761 |
| Croatians | 97.3 /100 | #107 | Exceptional $90,685 |
| Zimbabweans | 97.2 /100 | #108 | Exceptional $90,618 |
| Chileans | 97.2 /100 | #109 | Exceptional $90,605 |
Demographics Similar to Cree by Median Household Income
In terms of median household income, the demographic groups most similar to Cree are Yaqui ($74,596, a difference of 0.12%), Central American Indian ($74,847, a difference of 0.22%), Immigrants from Liberia ($74,896, a difference of 0.28%), Mexican ($74,399, a difference of 0.39%), and Senegalese ($74,999, a difference of 0.42%).
| Demographics | Rating | Rank | Median Household Income |
| Immigrants | Latin America | 0.2 /100 | #276 | Tragic $75,420 |
| Spanish Americans | 0.2 /100 | #277 | Tragic $75,386 |
| Osage | 0.2 /100 | #278 | Tragic $75,240 |
| Immigrants | Guatemala | 0.2 /100 | #279 | Tragic $75,123 |
| Senegalese | 0.2 /100 | #280 | Tragic $74,999 |
| Immigrants | Liberia | 0.1 /100 | #281 | Tragic $74,896 |
| Central American Indians | 0.1 /100 | #282 | Tragic $74,847 |
| Cree | 0.1 /100 | #283 | Tragic $74,685 |
| Yaqui | 0.1 /100 | #284 | Tragic $74,596 |
| Mexicans | 0.1 /100 | #285 | Tragic $74,399 |
| Immigrants | Somalia | 0.1 /100 | #286 | Tragic $74,300 |
| Iroquois | 0.1 /100 | #287 | Tragic $74,279 |
| Immigrants | Central America | 0.1 /100 | #288 | Tragic $74,217 |
| Fijians | 0.1 /100 | #289 | Tragic $74,205 |
| Bangladeshis | 0.1 /100 | #290 | Tragic $74,112 |