Bermudan vs Cree Median Household Income
COMPARE
Bermudan
Cree
Median Household Income
Median Household Income Comparison
Bermudans
Cree
$80,406
MEDIAN HOUSEHOLD INCOME
4.7/ 100
METRIC RATING
230th/ 347
METRIC RANK
$74,685
MEDIAN HOUSEHOLD INCOME
0.1/ 100
METRIC RATING
283rd/ 347
METRIC RANK
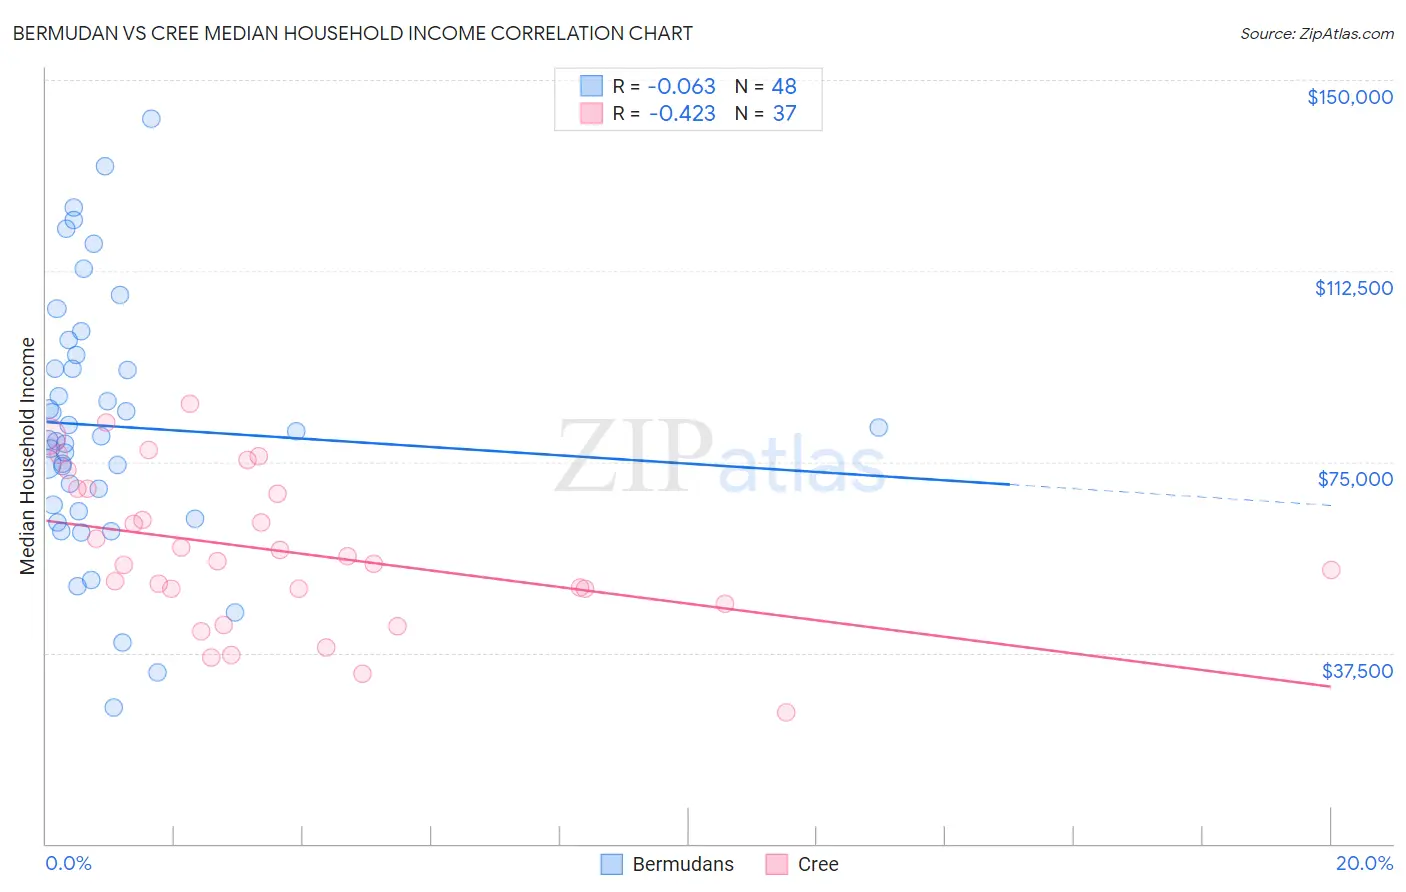
Bermudan vs Cree Median Household Income Correlation Chart
The statistical analysis conducted on geographies consisting of 55,709,060 people shows a slight negative correlation between the proportion of Bermudans and median household income in the United States with a correlation coefficient (R) of -0.063 and weighted average of $80,406. Similarly, the statistical analysis conducted on geographies consisting of 76,206,119 people shows a moderate negative correlation between the proportion of Cree and median household income in the United States with a correlation coefficient (R) of -0.423 and weighted average of $74,685, a difference of 7.7%.
Median Household Income Correlation Summary
| Measurement | Bermudan | Cree |
| Minimum | $26,741 | $25,833 |
| Maximum | $142,500 | $86,509 |
| Range | $115,759 | $60,676 |
| Mean | $82,030 | $57,468 |
| Median | $79,684 | $55,368 |
| Interquartile 25% (IQ1) | $65,991 | $48,609 |
| Interquartile 75% (IQ3) | $94,631 | $69,690 |
| Interquartile Range (IQR) | $28,640 | $21,081 |
| Standard Deviation (Sample) | $25,052 | $14,992 |
| Standard Deviation (Population) | $24,789 | $14,788 |
Similar Demographics by Median Household Income
Demographics Similar to Bermudans by Median Household Income
In terms of median household income, the demographic groups most similar to Bermudans are Trinidadian and Tobagonian ($80,402, a difference of 0.010%), Immigrants from Trinidad and Tobago ($80,373, a difference of 0.040%), Immigrants from the Azores ($80,357, a difference of 0.060%), Immigrants from Ecuador ($80,341, a difference of 0.080%), and Immigrants from Guyana ($80,324, a difference of 0.10%).
| Demographics | Rating | Rank | Median Household Income |
| Immigrants | El Salvador | 7.6 /100 | #223 | Tragic $81,213 |
| Malaysians | 7.0 /100 | #224 | Tragic $81,064 |
| Scotch-Irish | 6.6 /100 | #225 | Tragic $80,972 |
| Immigrants | Panama | 6.2 /100 | #226 | Tragic $80,873 |
| Guyanese | 5.7 /100 | #227 | Tragic $80,734 |
| Immigrants | Bangladesh | 5.7 /100 | #228 | Tragic $80,722 |
| Delaware | 5.0 /100 | #229 | Tragic $80,527 |
| Bermudans | 4.7 /100 | #230 | Tragic $80,406 |
| Trinidadians and Tobagonians | 4.7 /100 | #231 | Tragic $80,402 |
| Immigrants | Trinidad and Tobago | 4.6 /100 | #232 | Tragic $80,373 |
| Immigrants | Azores | 4.5 /100 | #233 | Tragic $80,357 |
| Immigrants | Ecuador | 4.5 /100 | #234 | Tragic $80,341 |
| Immigrants | Guyana | 4.5 /100 | #235 | Tragic $80,324 |
| Immigrants | Bosnia and Herzegovina | 3.4 /100 | #236 | Tragic $79,888 |
| Nicaraguans | 3.1 /100 | #237 | Tragic $79,737 |
Demographics Similar to Cree by Median Household Income
In terms of median household income, the demographic groups most similar to Cree are Yaqui ($74,596, a difference of 0.12%), Central American Indian ($74,847, a difference of 0.22%), Immigrants from Liberia ($74,896, a difference of 0.28%), Mexican ($74,399, a difference of 0.39%), and Senegalese ($74,999, a difference of 0.42%).
| Demographics | Rating | Rank | Median Household Income |
| Immigrants | Latin America | 0.2 /100 | #276 | Tragic $75,420 |
| Spanish Americans | 0.2 /100 | #277 | Tragic $75,386 |
| Osage | 0.2 /100 | #278 | Tragic $75,240 |
| Immigrants | Guatemala | 0.2 /100 | #279 | Tragic $75,123 |
| Senegalese | 0.2 /100 | #280 | Tragic $74,999 |
| Immigrants | Liberia | 0.1 /100 | #281 | Tragic $74,896 |
| Central American Indians | 0.1 /100 | #282 | Tragic $74,847 |
| Cree | 0.1 /100 | #283 | Tragic $74,685 |
| Yaqui | 0.1 /100 | #284 | Tragic $74,596 |
| Mexicans | 0.1 /100 | #285 | Tragic $74,399 |
| Immigrants | Somalia | 0.1 /100 | #286 | Tragic $74,300 |
| Iroquois | 0.1 /100 | #287 | Tragic $74,279 |
| Immigrants | Central America | 0.1 /100 | #288 | Tragic $74,217 |
| Fijians | 0.1 /100 | #289 | Tragic $74,205 |
| Bangladeshis | 0.1 /100 | #290 | Tragic $74,112 |