Australian vs Belizean Median Female Earnings
COMPARE
Australian
Belizean
Median Female Earnings
Median Female Earnings Comparison
Australians
Belizeans
$43,308
MEDIAN FEMALE EARNINGS
99.9/ 100
METRIC RATING
54th/ 347
METRIC RANK
$37,429
MEDIAN FEMALE EARNINGS
0.9/ 100
METRIC RATING
258th/ 347
METRIC RANK
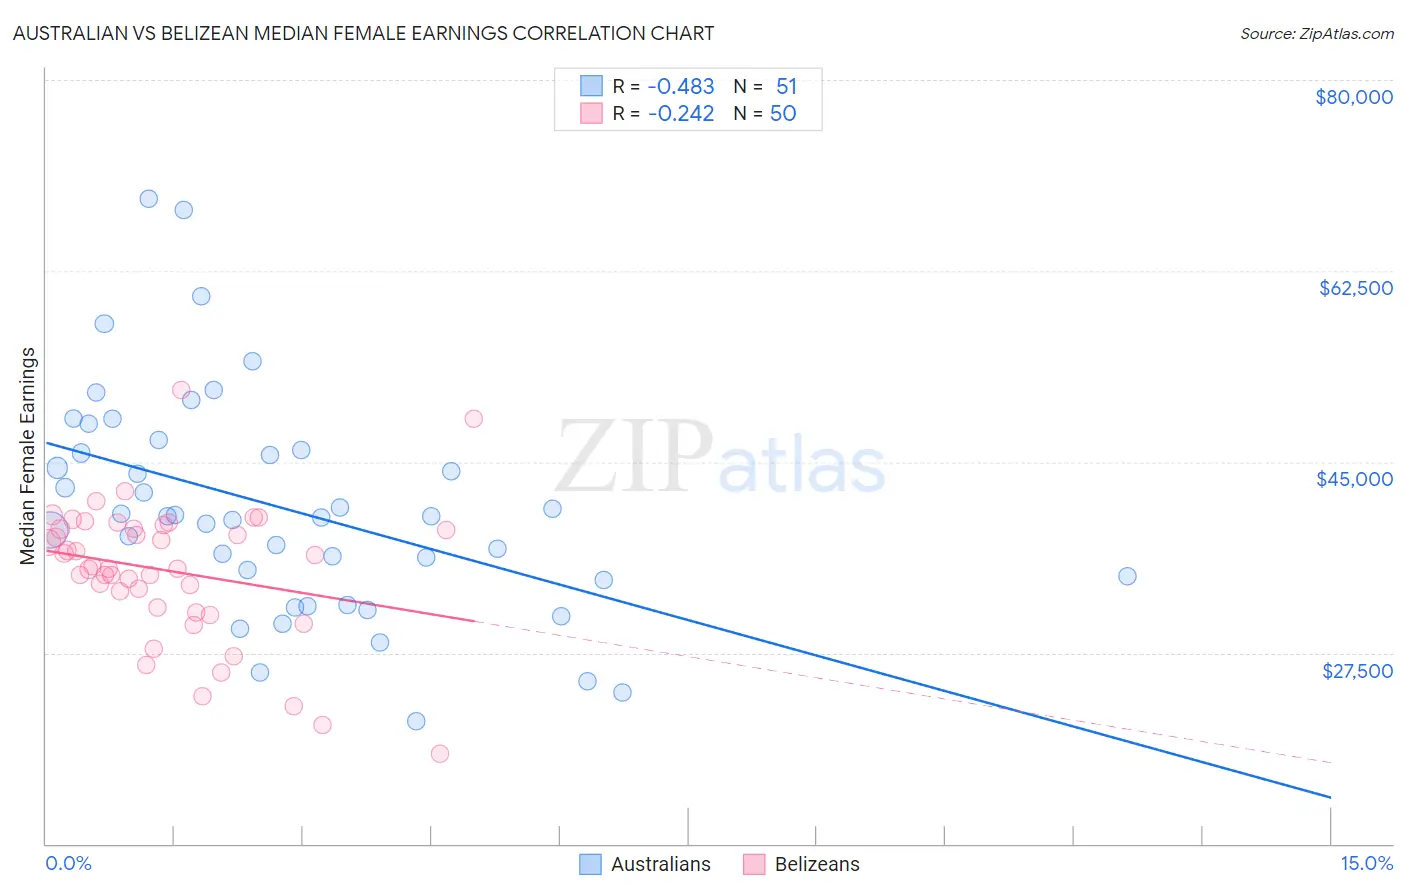
Australian vs Belizean Median Female Earnings Correlation Chart
The statistical analysis conducted on geographies consisting of 224,101,413 people shows a moderate negative correlation between the proportion of Australians and median female earnings in the United States with a correlation coefficient (R) of -0.483 and weighted average of $43,308. Similarly, the statistical analysis conducted on geographies consisting of 144,203,712 people shows a weak negative correlation between the proportion of Belizeans and median female earnings in the United States with a correlation coefficient (R) of -0.242 and weighted average of $37,429, a difference of 15.7%.
Median Female Earnings Correlation Summary
| Measurement | Australian | Belizean |
| Minimum | $21,275 | $18,201 |
| Maximum | $69,107 | $51,565 |
| Range | $47,832 | $33,364 |
| Mean | $40,748 | $34,988 |
| Median | $40,021 | $35,337 |
| Interquartile 25% (IQ1) | $34,140 | $31,707 |
| Interquartile 75% (IQ3) | $46,088 | $38,920 |
| Interquartile Range (IQR) | $11,949 | $7,213 |
| Standard Deviation (Sample) | $10,236 | $6,353 |
| Standard Deviation (Population) | $10,135 | $6,289 |
Similar Demographics by Median Female Earnings
Demographics Similar to Australians by Median Female Earnings
In terms of median female earnings, the demographic groups most similar to Australians are Immigrants from Eastern Europe ($43,309, a difference of 0.0%), Egyptian ($43,305, a difference of 0.010%), Immigrants from Lithuania ($43,317, a difference of 0.020%), Maltese ($43,357, a difference of 0.11%), and Immigrants from Croatia ($43,258, a difference of 0.11%).
| Demographics | Rating | Rank | Median Female Earnings |
| Bolivians | 100.0 /100 | #47 | Exceptional $43,445 |
| Immigrants | Indonesia | 100.0 /100 | #48 | Exceptional $43,412 |
| Immigrants | Serbia | 100.0 /100 | #49 | Exceptional $43,385 |
| Immigrants | Uzbekistan | 100.0 /100 | #50 | Exceptional $43,363 |
| Maltese | 100.0 /100 | #51 | Exceptional $43,357 |
| Immigrants | Lithuania | 99.9 /100 | #52 | Exceptional $43,317 |
| Immigrants | Eastern Europe | 99.9 /100 | #53 | Exceptional $43,309 |
| Australians | 99.9 /100 | #54 | Exceptional $43,308 |
| Egyptians | 99.9 /100 | #55 | Exceptional $43,305 |
| Immigrants | Croatia | 99.9 /100 | #56 | Exceptional $43,258 |
| Ethiopians | 99.9 /100 | #57 | Exceptional $43,243 |
| Paraguayans | 99.9 /100 | #58 | Exceptional $43,173 |
| Estonians | 99.9 /100 | #59 | Exceptional $43,106 |
| Immigrants | Latvia | 99.9 /100 | #60 | Exceptional $43,099 |
| Immigrants | Bulgaria | 99.9 /100 | #61 | Exceptional $43,085 |
Demographics Similar to Belizeans by Median Female Earnings
In terms of median female earnings, the demographic groups most similar to Belizeans are Scotch-Irish ($37,383, a difference of 0.12%), Hawaiian ($37,497, a difference of 0.18%), Samoan ($37,498, a difference of 0.19%), Colville ($37,514, a difference of 0.23%), and Dutch ($37,339, a difference of 0.24%).
| Demographics | Rating | Rank | Median Female Earnings |
| Welsh | 2.1 /100 | #251 | Tragic $37,856 |
| Immigrants | Dominica | 2.0 /100 | #252 | Tragic $37,825 |
| Danes | 1.6 /100 | #253 | Tragic $37,730 |
| Whites/Caucasians | 1.1 /100 | #254 | Tragic $37,531 |
| Colville | 1.1 /100 | #255 | Tragic $37,514 |
| Samoans | 1.0 /100 | #256 | Tragic $37,498 |
| Hawaiians | 1.0 /100 | #257 | Tragic $37,497 |
| Belizeans | 0.9 /100 | #258 | Tragic $37,429 |
| Scotch-Irish | 0.8 /100 | #259 | Tragic $37,383 |
| Dutch | 0.7 /100 | #260 | Tragic $37,339 |
| Malaysians | 0.7 /100 | #261 | Tragic $37,298 |
| Venezuelans | 0.7 /100 | #262 | Tragic $37,282 |
| German Russians | 0.5 /100 | #263 | Tragic $37,105 |
| Salvadorans | 0.4 /100 | #264 | Tragic $37,083 |
| Immigrants | Belize | 0.4 /100 | #265 | Tragic $37,056 |