Colville vs Polish Median Family Income
COMPARE
Colville
Polish
Median Family Income
Median Family Income Comparison
Colville
Poles
$85,792
MEDIAN FAMILY INCOME
0.0/ 100
METRIC RATING
301st/ 347
METRIC RANK
$108,507
MEDIAN FAMILY INCOME
95.2/ 100
METRIC RATING
114th/ 347
METRIC RANK
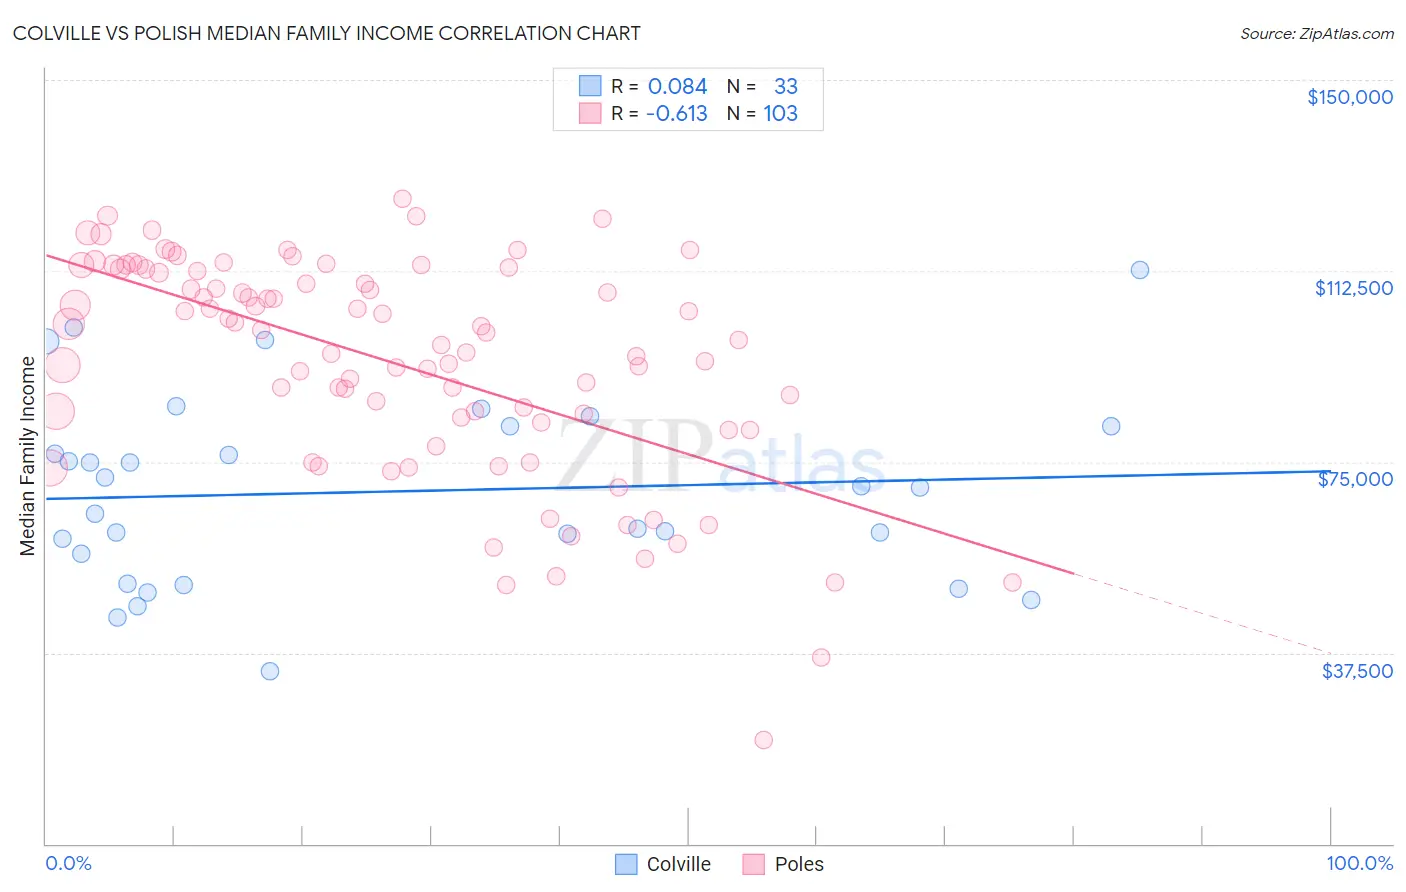
Colville vs Polish Median Family Income Correlation Chart
The statistical analysis conducted on geographies consisting of 34,680,416 people shows a slight positive correlation between the proportion of Colville and median family income in the United States with a correlation coefficient (R) of 0.084 and weighted average of $85,792. Similarly, the statistical analysis conducted on geographies consisting of 559,354,572 people shows a significant negative correlation between the proportion of Poles and median family income in the United States with a correlation coefficient (R) of -0.613 and weighted average of $108,507, a difference of 26.5%.
Median Family Income Correlation Summary
| Measurement | Colville | Polish |
| Minimum | $33,824 | $20,484 |
| Maximum | $112,639 | $126,779 |
| Range | $78,815 | $106,295 |
| Mean | $69,185 | $94,533 |
| Median | $70,000 | $100,344 |
| Interquartile 25% (IQ1) | $53,997 | $82,684 |
| Interquartile 75% (IQ3) | $82,061 | $112,830 |
| Interquartile Range (IQR) | $28,064 | $30,146 |
| Standard Deviation (Sample) | $18,382 | $21,570 |
| Standard Deviation (Population) | $18,102 | $21,465 |
Similar Demographics by Median Family Income
Demographics Similar to Colville by Median Family Income
In terms of median family income, the demographic groups most similar to Colville are Spanish American Indian ($85,728, a difference of 0.070%), Hispanic or Latino ($85,647, a difference of 0.17%), Mexican ($85,618, a difference of 0.20%), Paiute ($85,414, a difference of 0.44%), and Immigrants from Dominica ($85,411, a difference of 0.45%).
| Demographics | Rating | Rank | Median Family Income |
| Fijians | 0.0 /100 | #294 | Tragic $87,387 |
| Yaqui | 0.0 /100 | #295 | Tragic $87,289 |
| Immigrants | Guatemala | 0.0 /100 | #296 | Tragic $87,191 |
| Cajuns | 0.0 /100 | #297 | Tragic $87,157 |
| Immigrants | Latin America | 0.0 /100 | #298 | Tragic $86,989 |
| Chippewa | 0.0 /100 | #299 | Tragic $86,852 |
| Ottawa | 0.0 /100 | #300 | Tragic $86,380 |
| Colville | 0.0 /100 | #301 | Tragic $85,792 |
| Spanish American Indians | 0.0 /100 | #302 | Tragic $85,728 |
| Hispanics or Latinos | 0.0 /100 | #303 | Tragic $85,647 |
| Mexicans | 0.0 /100 | #304 | Tragic $85,618 |
| Paiute | 0.0 /100 | #305 | Tragic $85,414 |
| Immigrants | Dominica | 0.0 /100 | #306 | Tragic $85,411 |
| Chickasaw | 0.0 /100 | #307 | Tragic $85,356 |
| U.S. Virgin Islanders | 0.0 /100 | #308 | Tragic $85,294 |
Demographics Similar to Poles by Median Family Income
In terms of median family income, the demographic groups most similar to Poles are Swedish ($108,499, a difference of 0.010%), Immigrants from Saudi Arabia ($108,544, a difference of 0.030%), Immigrants from Poland ($108,570, a difference of 0.060%), Chilean ($108,429, a difference of 0.070%), and Immigrants from Western Asia ($108,691, a difference of 0.17%).
| Demographics | Rating | Rank | Median Family Income |
| Immigrants | North Macedonia | 96.4 /100 | #107 | Exceptional $109,136 |
| Immigrants | Zimbabwe | 95.9 /100 | #108 | Exceptional $108,830 |
| Immigrants | Afghanistan | 95.6 /100 | #109 | Exceptional $108,709 |
| British | 95.6 /100 | #110 | Exceptional $108,705 |
| Immigrants | Western Asia | 95.6 /100 | #111 | Exceptional $108,691 |
| Immigrants | Poland | 95.3 /100 | #112 | Exceptional $108,570 |
| Immigrants | Saudi Arabia | 95.2 /100 | #113 | Exceptional $108,544 |
| Poles | 95.2 /100 | #114 | Exceptional $108,507 |
| Swedes | 95.1 /100 | #115 | Exceptional $108,499 |
| Chileans | 95.0 /100 | #116 | Exceptional $108,429 |
| Immigrants | Philippines | 94.6 /100 | #117 | Exceptional $108,288 |
| Ethiopians | 94.5 /100 | #118 | Exceptional $108,251 |
| Sri Lankans | 94.5 /100 | #119 | Exceptional $108,234 |
| Immigrants | Northern Africa | 94.3 /100 | #120 | Exceptional $108,161 |
| Europeans | 94.1 /100 | #121 | Exceptional $108,099 |