Immigrants from Belgium vs Polish Median Family Income
COMPARE
Immigrants from Belgium
Polish
Median Family Income
Median Family Income Comparison
Immigrants from Belgium
Poles
$123,831
MEDIAN FAMILY INCOME
100.0/ 100
METRIC RATING
19th/ 347
METRIC RANK
$108,507
MEDIAN FAMILY INCOME
95.2/ 100
METRIC RATING
114th/ 347
METRIC RANK
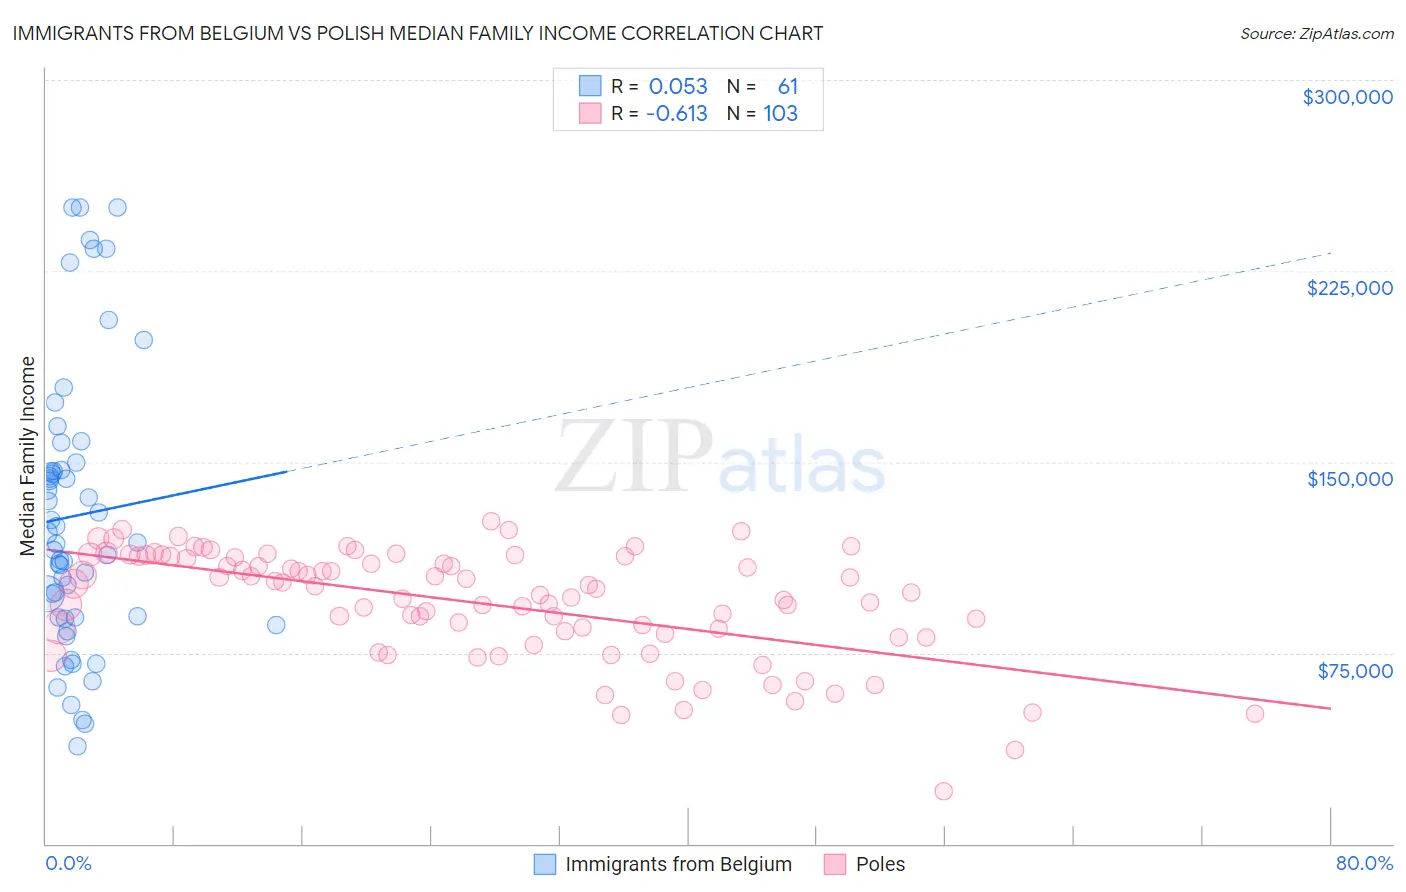
Immigrants from Belgium vs Polish Median Family Income Correlation Chart
The statistical analysis conducted on geographies consisting of 146,657,089 people shows a slight positive correlation between the proportion of Immigrants from Belgium and median family income in the United States with a correlation coefficient (R) of 0.053 and weighted average of $123,831. Similarly, the statistical analysis conducted on geographies consisting of 559,354,572 people shows a significant negative correlation between the proportion of Poles and median family income in the United States with a correlation coefficient (R) of -0.613 and weighted average of $108,507, a difference of 14.1%.
Median Family Income Correlation Summary
| Measurement | Immigrants from Belgium | Polish |
| Minimum | $38,056 | $20,484 |
| Maximum | $250,001 | $126,779 |
| Range | $211,945 | $106,295 |
| Mean | $128,845 | $94,533 |
| Median | $118,563 | $100,344 |
| Interquartile 25% (IQ1) | $88,684 | $82,684 |
| Interquartile 75% (IQ3) | $148,325 | $112,830 |
| Interquartile Range (IQR) | $59,642 | $30,146 |
| Standard Deviation (Sample) | $54,287 | $21,570 |
| Standard Deviation (Population) | $53,840 | $21,465 |
Similar Demographics by Median Family Income
Demographics Similar to Immigrants from Belgium by Median Family Income
In terms of median family income, the demographic groups most similar to Immigrants from Belgium are Burmese ($123,369, a difference of 0.37%), Immigrants from Korea ($122,800, a difference of 0.84%), Immigrants from Sweden ($122,765, a difference of 0.87%), Immigrants from Japan ($122,764, a difference of 0.87%), and Immigrants from Eastern Asia ($125,150, a difference of 1.1%).
| Demographics | Rating | Rank | Median Family Income |
| Cypriots | 100.0 /100 | #12 | Exceptional $127,064 |
| Immigrants | Australia | 100.0 /100 | #13 | Exceptional $126,620 |
| Immigrants | South Central Asia | 100.0 /100 | #14 | Exceptional $125,956 |
| Eastern Europeans | 100.0 /100 | #15 | Exceptional $125,546 |
| Immigrants | China | 100.0 /100 | #16 | Exceptional $125,540 |
| Indians (Asian) | 100.0 /100 | #17 | Exceptional $125,312 |
| Immigrants | Eastern Asia | 100.0 /100 | #18 | Exceptional $125,150 |
| Immigrants | Belgium | 100.0 /100 | #19 | Exceptional $123,831 |
| Burmese | 100.0 /100 | #20 | Exceptional $123,369 |
| Immigrants | Korea | 100.0 /100 | #21 | Exceptional $122,800 |
| Immigrants | Sweden | 100.0 /100 | #22 | Exceptional $122,765 |
| Immigrants | Japan | 100.0 /100 | #23 | Exceptional $122,764 |
| Immigrants | Northern Europe | 100.0 /100 | #24 | Exceptional $121,840 |
| Turks | 100.0 /100 | #25 | Exceptional $121,202 |
| Immigrants | Switzerland | 100.0 /100 | #26 | Exceptional $120,726 |
Demographics Similar to Poles by Median Family Income
In terms of median family income, the demographic groups most similar to Poles are Swedish ($108,499, a difference of 0.010%), Immigrants from Saudi Arabia ($108,544, a difference of 0.030%), Immigrants from Poland ($108,570, a difference of 0.060%), Chilean ($108,429, a difference of 0.070%), and Immigrants from Western Asia ($108,691, a difference of 0.17%).
| Demographics | Rating | Rank | Median Family Income |
| Immigrants | North Macedonia | 96.4 /100 | #107 | Exceptional $109,136 |
| Immigrants | Zimbabwe | 95.9 /100 | #108 | Exceptional $108,830 |
| Immigrants | Afghanistan | 95.6 /100 | #109 | Exceptional $108,709 |
| British | 95.6 /100 | #110 | Exceptional $108,705 |
| Immigrants | Western Asia | 95.6 /100 | #111 | Exceptional $108,691 |
| Immigrants | Poland | 95.3 /100 | #112 | Exceptional $108,570 |
| Immigrants | Saudi Arabia | 95.2 /100 | #113 | Exceptional $108,544 |
| Poles | 95.2 /100 | #114 | Exceptional $108,507 |
| Swedes | 95.1 /100 | #115 | Exceptional $108,499 |
| Chileans | 95.0 /100 | #116 | Exceptional $108,429 |
| Immigrants | Philippines | 94.6 /100 | #117 | Exceptional $108,288 |
| Ethiopians | 94.5 /100 | #118 | Exceptional $108,251 |
| Sri Lankans | 94.5 /100 | #119 | Exceptional $108,234 |
| Immigrants | Northern Africa | 94.3 /100 | #120 | Exceptional $108,161 |
| Europeans | 94.1 /100 | #121 | Exceptional $108,099 |