Afghan vs French In Labor Force | Age 16-19
COMPARE
Afghan
French
In Labor Force | Age 16-19
In Labor Force | Age 16-19 Comparison
Afghans
French
36.1%
IN LABOR FORCE | AGE 16-19
25.7/ 100
METRIC RATING
192nd/ 347
METRIC RANK
42.1%
IN LABOR FORCE | AGE 16-19
100.0/ 100
METRIC RATING
29th/ 347
METRIC RANK
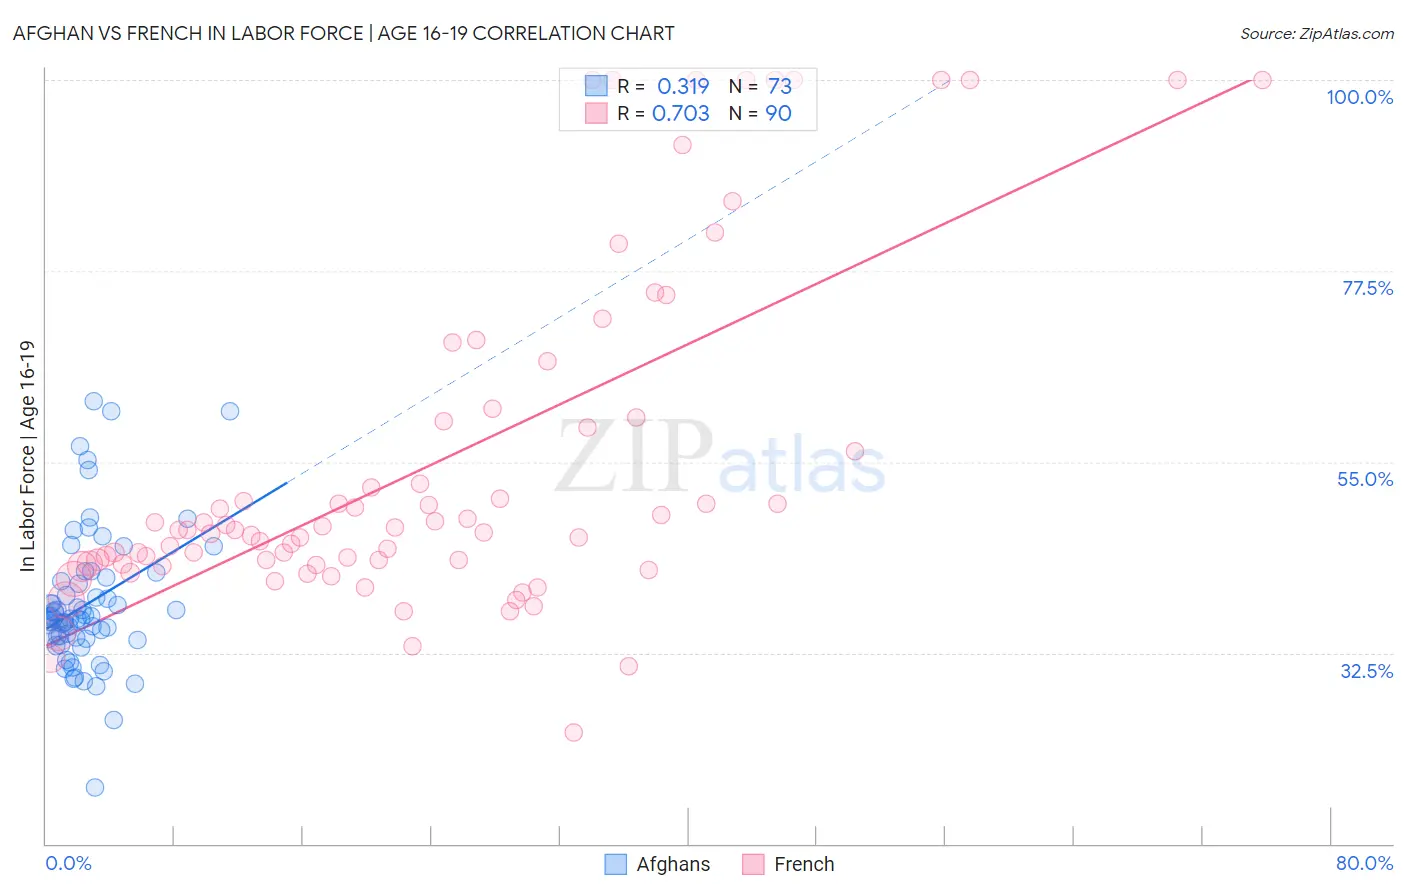
Afghan vs French In Labor Force | Age 16-19 Correlation Chart
The statistical analysis conducted on geographies consisting of 148,830,842 people shows a mild positive correlation between the proportion of Afghans and labor force participation rate among population between the ages 16 and 19 in the United States with a correlation coefficient (R) of 0.319 and weighted average of 36.1%. Similarly, the statistical analysis conducted on geographies consisting of 568,177,224 people shows a strong positive correlation between the proportion of French and labor force participation rate among population between the ages 16 and 19 in the United States with a correlation coefficient (R) of 0.703 and weighted average of 42.1%, a difference of 16.7%.
In Labor Force | Age 16-19 Correlation Summary
| Measurement | Afghan | French |
| Minimum | 16.7% | 23.1% |
| Maximum | 62.2% | 100.0% |
| Range | 45.5% | 76.9% |
| Mean | 38.3% | 54.6% |
| Median | 36.5% | 47.0% |
| Interquartile 25% (IQ1) | 34.2% | 43.0% |
| Interquartile 75% (IQ3) | 41.1% | 59.8% |
| Interquartile Range (IQR) | 6.9% | 16.9% |
| Standard Deviation (Sample) | 8.1% | 20.0% |
| Standard Deviation (Population) | 8.1% | 19.9% |
Similar Demographics by In Labor Force | Age 16-19
Demographics Similar to Afghans by In Labor Force | Age 16-19
In terms of in labor force | age 16-19, the demographic groups most similar to Afghans are Immigrants from Denmark (36.1%, a difference of 0.040%), Nigerian (36.1%, a difference of 0.070%), Immigrants from Croatia (36.1%, a difference of 0.12%), Bolivian (36.0%, a difference of 0.16%), and Panamanian (36.1%, a difference of 0.19%).
| Demographics | Rating | Rank | In Labor Force | Age 16-19 |
| Bhutanese | 35.3 /100 | #185 | Fair 36.3% |
| Immigrants | Romania | 34.0 /100 | #186 | Fair 36.3% |
| Immigrants | Afghanistan | 34.0 /100 | #187 | Fair 36.3% |
| Immigrants | Europe | 31.8 /100 | #188 | Fair 36.2% |
| Immigrants | Hungary | 28.8 /100 | #189 | Fair 36.2% |
| Panamanians | 28.6 /100 | #190 | Fair 36.1% |
| Immigrants | Croatia | 27.5 /100 | #191 | Fair 36.1% |
| Afghans | 25.7 /100 | #192 | Fair 36.1% |
| Immigrants | Denmark | 25.0 /100 | #193 | Fair 36.1% |
| Nigerians | 24.6 /100 | #194 | Fair 36.1% |
| Bolivians | 23.3 /100 | #195 | Fair 36.0% |
| Mexican American Indians | 21.1 /100 | #196 | Fair 36.0% |
| Immigrants | Serbia | 21.0 /100 | #197 | Fair 36.0% |
| Immigrants | Northern Africa | 19.9 /100 | #198 | Poor 35.9% |
| Immigrants | Norway | 19.8 /100 | #199 | Poor 35.9% |
Demographics Similar to French by In Labor Force | Age 16-19
In terms of in labor force | age 16-19, the demographic groups most similar to French are Polish (42.1%, a difference of 0.050%), Scottish (42.0%, a difference of 0.28%), Welsh (42.3%, a difference of 0.35%), Irish (42.0%, a difference of 0.35%), and Czechoslovakian (41.9%, a difference of 0.55%).
| Demographics | Rating | Rank | In Labor Force | Age 16-19 |
| Sudanese | 100.0 /100 | #22 | Exceptional 42.9% |
| Slovaks | 100.0 /100 | #23 | Exceptional 42.6% |
| Bangladeshis | 100.0 /100 | #24 | Exceptional 42.5% |
| German Russians | 100.0 /100 | #25 | Exceptional 42.4% |
| English | 100.0 /100 | #26 | Exceptional 42.4% |
| Welsh | 100.0 /100 | #27 | Exceptional 42.3% |
| Poles | 100.0 /100 | #28 | Exceptional 42.1% |
| French | 100.0 /100 | #29 | Exceptional 42.1% |
| Scottish | 100.0 /100 | #30 | Exceptional 42.0% |
| Irish | 100.0 /100 | #31 | Exceptional 42.0% |
| Czechoslovakians | 100.0 /100 | #32 | Exceptional 41.9% |
| Liberians | 100.0 /100 | #33 | Exceptional 41.8% |
| Immigrants | Bosnia and Herzegovina | 100.0 /100 | #34 | Exceptional 41.8% |
| Yugoslavians | 100.0 /100 | #35 | Exceptional 41.8% |
| Immigrants | Azores | 100.0 /100 | #36 | Exceptional 41.7% |