Zip Codes with the Highest Percentage of Population Employed in Legal Services & Support in West Des Moines, IA
RELATED REPORTS & OPTIONS
Legal Services & Support
West Des Moines
Compare Zip Codes
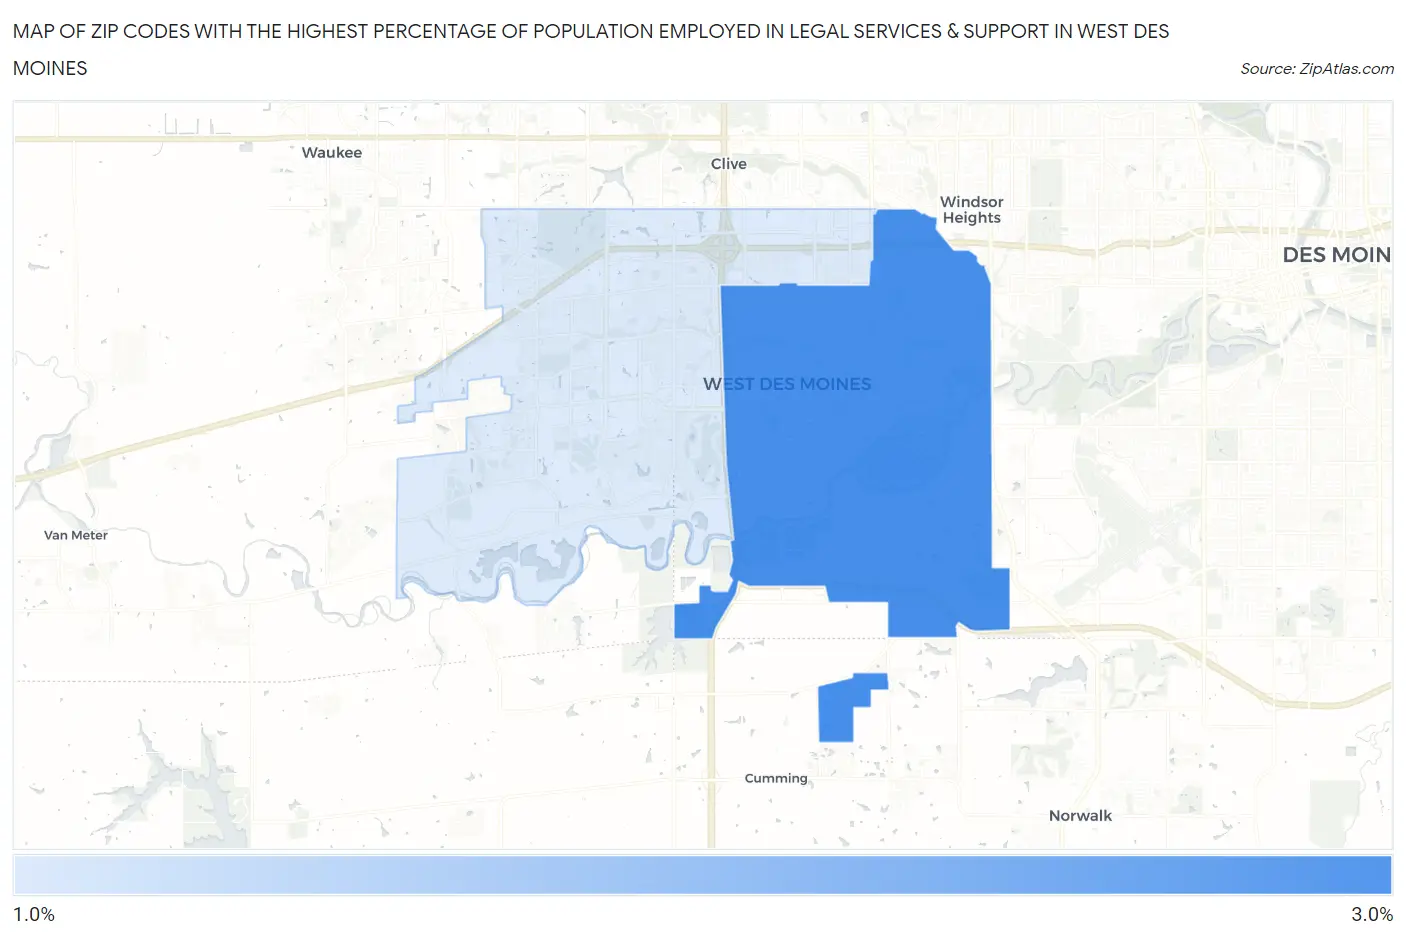
Map of Zip Codes with the Highest Percentage of Population Employed in Legal Services & Support in West Des Moines
1.1%
2.6%
Zip Codes with the Highest Percentage of Population Employed in Legal Services & Support in West Des Moines, IA
| Zip Code | % Employed | vs State | vs National | |
| 1. | 50265 | 2.6% | 0.75%(+1.88)#31 | 1.2%(+1.44)#2,305 |
| 2. | 50266 | 1.1% | 0.75%(+0.321)#116 | 1.2%(-0.118)#7,382 |
1
Common Questions
What are the Top Zip Codes with the Highest Percentage of Population Employed in Legal Services & Support in West Des Moines, IA?
Top Zip Codes with the Highest Percentage of Population Employed in Legal Services & Support in West Des Moines, IA are:
What zip code has the Highest Percentage of Population Employed in Legal Services & Support in West Des Moines, IA?
50265 has the Highest Percentage of Population Employed in Legal Services & Support in West Des Moines, IA with 2.6%.
What is the Percentage of Population Employed in Legal Services & Support in West Des Moines, IA?
Percentage of Population Employed in Legal Services & Support in West Des Moines is 1.8%.
What is the Percentage of Population Employed in Legal Services & Support in Iowa?
Percentage of Population Employed in Legal Services & Support in Iowa is 0.75%.
What is the Percentage of Population Employed in Legal Services & Support in the United States?
Percentage of Population Employed in Legal Services & Support in the United States is 1.2%.