Subsaharan African vs Lithuanian Divorced or Separated
COMPARE
Subsaharan African
Lithuanian
Divorced or Separated
Divorced or Separated Comparison
Sub-Saharan Africans
Lithuanians
12.7%
DIVORCED OR SEPARATED
0.1/ 100
METRIC RATING
282nd/ 347
METRIC RANK
11.7%
DIVORCED OR SEPARATED
95.7/ 100
METRIC RATING
115th/ 347
METRIC RANK
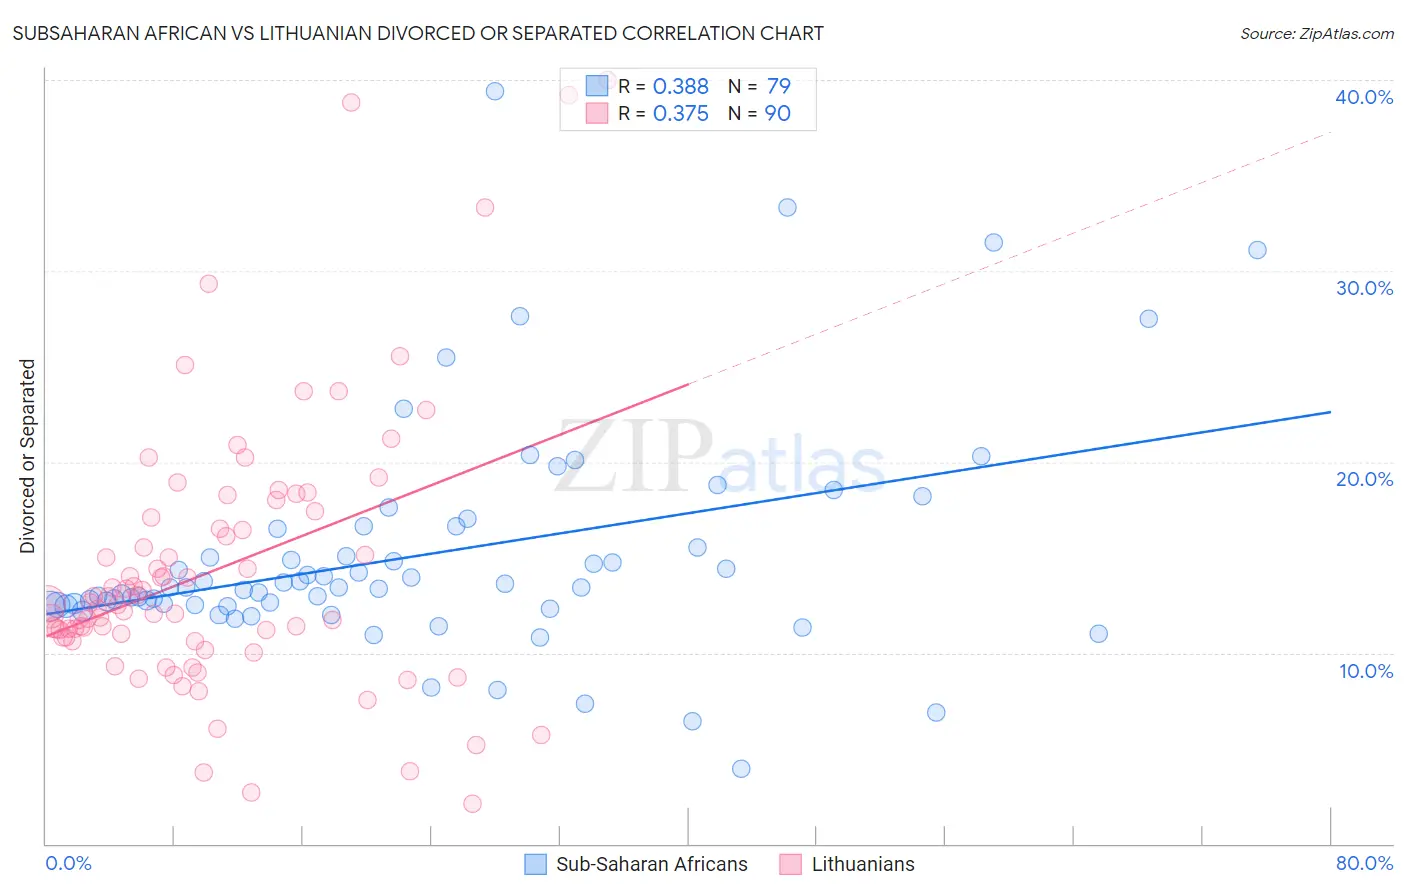
Subsaharan African vs Lithuanian Divorced or Separated Correlation Chart
The statistical analysis conducted on geographies consisting of 507,827,607 people shows a mild positive correlation between the proportion of Sub-Saharan Africans and percentage of population currently divorced or separated in the United States with a correlation coefficient (R) of 0.388 and weighted average of 12.7%. Similarly, the statistical analysis conducted on geographies consisting of 421,781,235 people shows a mild positive correlation between the proportion of Lithuanians and percentage of population currently divorced or separated in the United States with a correlation coefficient (R) of 0.375 and weighted average of 11.7%, a difference of 8.6%.
Divorced or Separated Correlation Summary
| Measurement | Subsaharan African | Lithuanian |
| Minimum | 3.9% | 2.1% |
| Maximum | 39.4% | 40.0% |
| Range | 35.5% | 37.9% |
| Mean | 15.1% | 14.4% |
| Median | 13.4% | 12.5% |
| Interquartile 25% (IQ1) | 12.5% | 10.8% |
| Interquartile 75% (IQ3) | 16.5% | 17.1% |
| Interquartile Range (IQR) | 4.0% | 6.3% |
| Standard Deviation (Sample) | 6.0% | 7.2% |
| Standard Deviation (Population) | 5.9% | 7.2% |
Similar Demographics by Divorced or Separated
Demographics Similar to Sub-Saharan Africans by Divorced or Separated
In terms of divorced or separated, the demographic groups most similar to Sub-Saharan Africans are Delaware (12.7%, a difference of 0.010%), Nonimmigrants (12.8%, a difference of 0.10%), Pueblo (12.7%, a difference of 0.12%), French (12.8%, a difference of 0.14%), and Immigrants from Zaire (12.7%, a difference of 0.16%).
| Demographics | Rating | Rank | Divorced or Separated |
| Central American Indians | 0.3 /100 | #275 | Tragic 12.7% |
| Spaniards | 0.2 /100 | #276 | Tragic 12.7% |
| Dominicans | 0.2 /100 | #277 | Tragic 12.7% |
| Lumbee | 0.2 /100 | #278 | Tragic 12.7% |
| Immigrants | Dominican Republic | 0.2 /100 | #279 | Tragic 12.7% |
| Immigrants | Zaire | 0.2 /100 | #280 | Tragic 12.7% |
| Pueblo | 0.2 /100 | #281 | Tragic 12.7% |
| Sub-Saharan Africans | 0.1 /100 | #282 | Tragic 12.7% |
| Delaware | 0.1 /100 | #283 | Tragic 12.7% |
| Immigrants | Nonimmigrants | 0.1 /100 | #284 | Tragic 12.8% |
| French | 0.1 /100 | #285 | Tragic 12.8% |
| Spanish | 0.1 /100 | #286 | Tragic 12.8% |
| Hondurans | 0.1 /100 | #287 | Tragic 12.8% |
| French Canadians | 0.1 /100 | #288 | Tragic 12.8% |
| Iroquois | 0.0 /100 | #289 | Tragic 12.9% |
Demographics Similar to Lithuanians by Divorced or Separated
In terms of divorced or separated, the demographic groups most similar to Lithuanians are Immigrants from Norway (11.7%, a difference of 0.050%), Immigrants from Iraq (11.7%, a difference of 0.060%), Immigrants from Uganda (11.7%, a difference of 0.080%), Ecuadorian (11.7%, a difference of 0.090%), and Syrian (11.7%, a difference of 0.13%).
| Demographics | Rating | Rank | Divorced or Separated |
| Greeks | 96.9 /100 | #108 | Exceptional 11.7% |
| Immigrants | South Africa | 96.9 /100 | #109 | Exceptional 11.7% |
| Immigrants | Czechoslovakia | 96.9 /100 | #110 | Exceptional 11.7% |
| Immigrants | Spain | 96.8 /100 | #111 | Exceptional 11.7% |
| Immigrants | France | 96.6 /100 | #112 | Exceptional 11.7% |
| Estonians | 96.6 /100 | #113 | Exceptional 11.7% |
| Immigrants | Norway | 95.9 /100 | #114 | Exceptional 11.7% |
| Lithuanians | 95.7 /100 | #115 | Exceptional 11.7% |
| Immigrants | Iraq | 95.4 /100 | #116 | Exceptional 11.7% |
| Immigrants | Uganda | 95.3 /100 | #117 | Exceptional 11.7% |
| Ecuadorians | 95.3 /100 | #118 | Exceptional 11.7% |
| Syrians | 95.1 /100 | #119 | Exceptional 11.7% |
| Iraqis | 94.6 /100 | #120 | Exceptional 11.8% |
| Romanians | 94.5 /100 | #121 | Exceptional 11.8% |
| Menominee | 93.8 /100 | #122 | Exceptional 11.8% |