Subsaharan African vs Yakama Divorced or Separated
COMPARE
Subsaharan African
Yakama
Divorced or Separated
Divorced or Separated Comparison
Sub-Saharan Africans
Yakama
12.7%
DIVORCED OR SEPARATED
0.1/ 100
METRIC RATING
282nd/ 347
METRIC RANK
12.3%
DIVORCED OR SEPARATED
7.8/ 100
METRIC RATING
230th/ 347
METRIC RANK
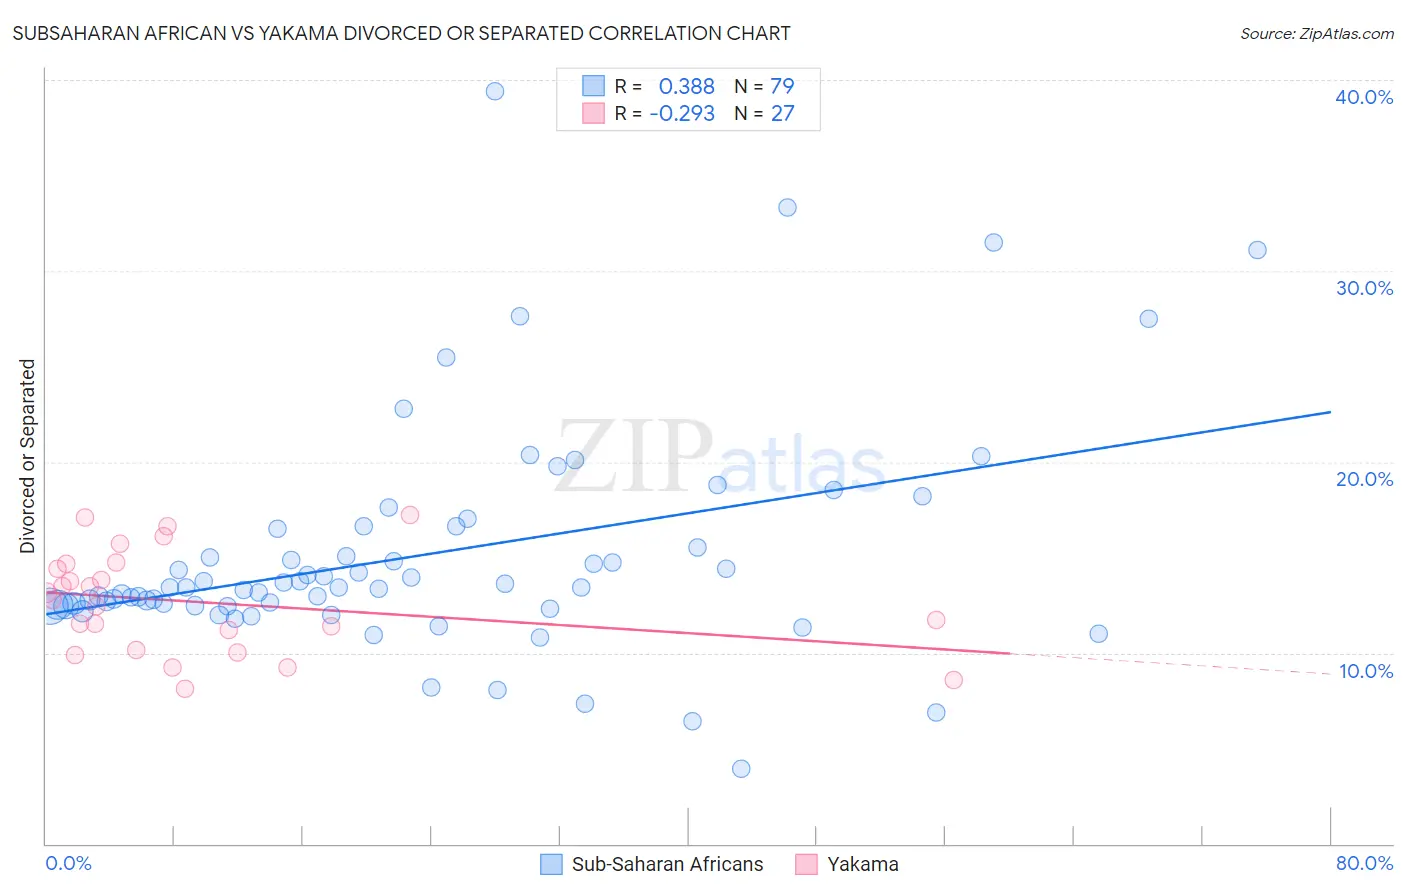
Subsaharan African vs Yakama Divorced or Separated Correlation Chart
The statistical analysis conducted on geographies consisting of 507,827,607 people shows a mild positive correlation between the proportion of Sub-Saharan Africans and percentage of population currently divorced or separated in the United States with a correlation coefficient (R) of 0.388 and weighted average of 12.7%. Similarly, the statistical analysis conducted on geographies consisting of 19,923,144 people shows a weak negative correlation between the proportion of Yakama and percentage of population currently divorced or separated in the United States with a correlation coefficient (R) of -0.293 and weighted average of 12.3%, a difference of 3.5%.
Divorced or Separated Correlation Summary
| Measurement | Subsaharan African | Yakama |
| Minimum | 3.9% | 8.1% |
| Maximum | 39.4% | 17.2% |
| Range | 35.5% | 9.1% |
| Mean | 15.1% | 12.7% |
| Median | 13.4% | 12.7% |
| Interquartile 25% (IQ1) | 12.5% | 10.1% |
| Interquartile 75% (IQ3) | 16.5% | 14.6% |
| Interquartile Range (IQR) | 4.0% | 4.5% |
| Standard Deviation (Sample) | 6.0% | 2.6% |
| Standard Deviation (Population) | 5.9% | 2.6% |
Similar Demographics by Divorced or Separated
Demographics Similar to Sub-Saharan Africans by Divorced or Separated
In terms of divorced or separated, the demographic groups most similar to Sub-Saharan Africans are Delaware (12.7%, a difference of 0.010%), Nonimmigrants (12.8%, a difference of 0.10%), Pueblo (12.7%, a difference of 0.12%), French (12.8%, a difference of 0.14%), and Immigrants from Zaire (12.7%, a difference of 0.16%).
| Demographics | Rating | Rank | Divorced or Separated |
| Central American Indians | 0.3 /100 | #275 | Tragic 12.7% |
| Spaniards | 0.2 /100 | #276 | Tragic 12.7% |
| Dominicans | 0.2 /100 | #277 | Tragic 12.7% |
| Lumbee | 0.2 /100 | #278 | Tragic 12.7% |
| Immigrants | Dominican Republic | 0.2 /100 | #279 | Tragic 12.7% |
| Immigrants | Zaire | 0.2 /100 | #280 | Tragic 12.7% |
| Pueblo | 0.2 /100 | #281 | Tragic 12.7% |
| Sub-Saharan Africans | 0.1 /100 | #282 | Tragic 12.7% |
| Delaware | 0.1 /100 | #283 | Tragic 12.7% |
| Immigrants | Nonimmigrants | 0.1 /100 | #284 | Tragic 12.8% |
| French | 0.1 /100 | #285 | Tragic 12.8% |
| Spanish | 0.1 /100 | #286 | Tragic 12.8% |
| Hondurans | 0.1 /100 | #287 | Tragic 12.8% |
| French Canadians | 0.1 /100 | #288 | Tragic 12.8% |
| Iroquois | 0.0 /100 | #289 | Tragic 12.9% |
Demographics Similar to Yakama by Divorced or Separated
In terms of divorced or separated, the demographic groups most similar to Yakama are Immigrants from Sudan (12.3%, a difference of 0.040%), Immigrants from Cameroon (12.3%, a difference of 0.060%), Hmong (12.3%, a difference of 0.11%), Yugoslavian (12.3%, a difference of 0.15%), and Immigrants from Western Africa (12.3%, a difference of 0.17%).
| Demographics | Rating | Rank | Divorced or Separated |
| Scandinavians | 10.4 /100 | #223 | Poor 12.3% |
| Immigrants | Azores | 9.7 /100 | #224 | Tragic 12.3% |
| Belgians | 9.7 /100 | #225 | Tragic 12.3% |
| Immigrants | Western Africa | 9.3 /100 | #226 | Tragic 12.3% |
| Hmong | 8.8 /100 | #227 | Tragic 12.3% |
| Immigrants | Cameroon | 8.3 /100 | #228 | Tragic 12.3% |
| Immigrants | Sudan | 8.2 /100 | #229 | Tragic 12.3% |
| Yakama | 7.8 /100 | #230 | Tragic 12.3% |
| Yugoslavians | 6.6 /100 | #231 | Tragic 12.3% |
| Canadians | 5.3 /100 | #232 | Tragic 12.4% |
| Malaysians | 4.8 /100 | #233 | Tragic 12.4% |
| West Indians | 4.4 /100 | #234 | Tragic 12.4% |
| Immigrants | Bosnia and Herzegovina | 4.3 /100 | #235 | Tragic 12.4% |
| Colombians | 4.2 /100 | #236 | Tragic 12.4% |
| Immigrants | Laos | 4.2 /100 | #237 | Tragic 12.4% |