Yup'ik vs Puget Sound Salish Births to Unmarried Women
COMPARE
Yup'ik
Puget Sound Salish
Births to Unmarried Women
Births to Unmarried Women Comparison
Yup'ik
Puget Sound Salish
56.4%
BIRTHS TO UNMARRIED WOMEN
0.0/ 100
METRIC RATING
347th/ 347
METRIC RANK
30.4%
BIRTHS TO UNMARRIED WOMEN
83.9/ 100
METRIC RATING
138th/ 347
METRIC RANK
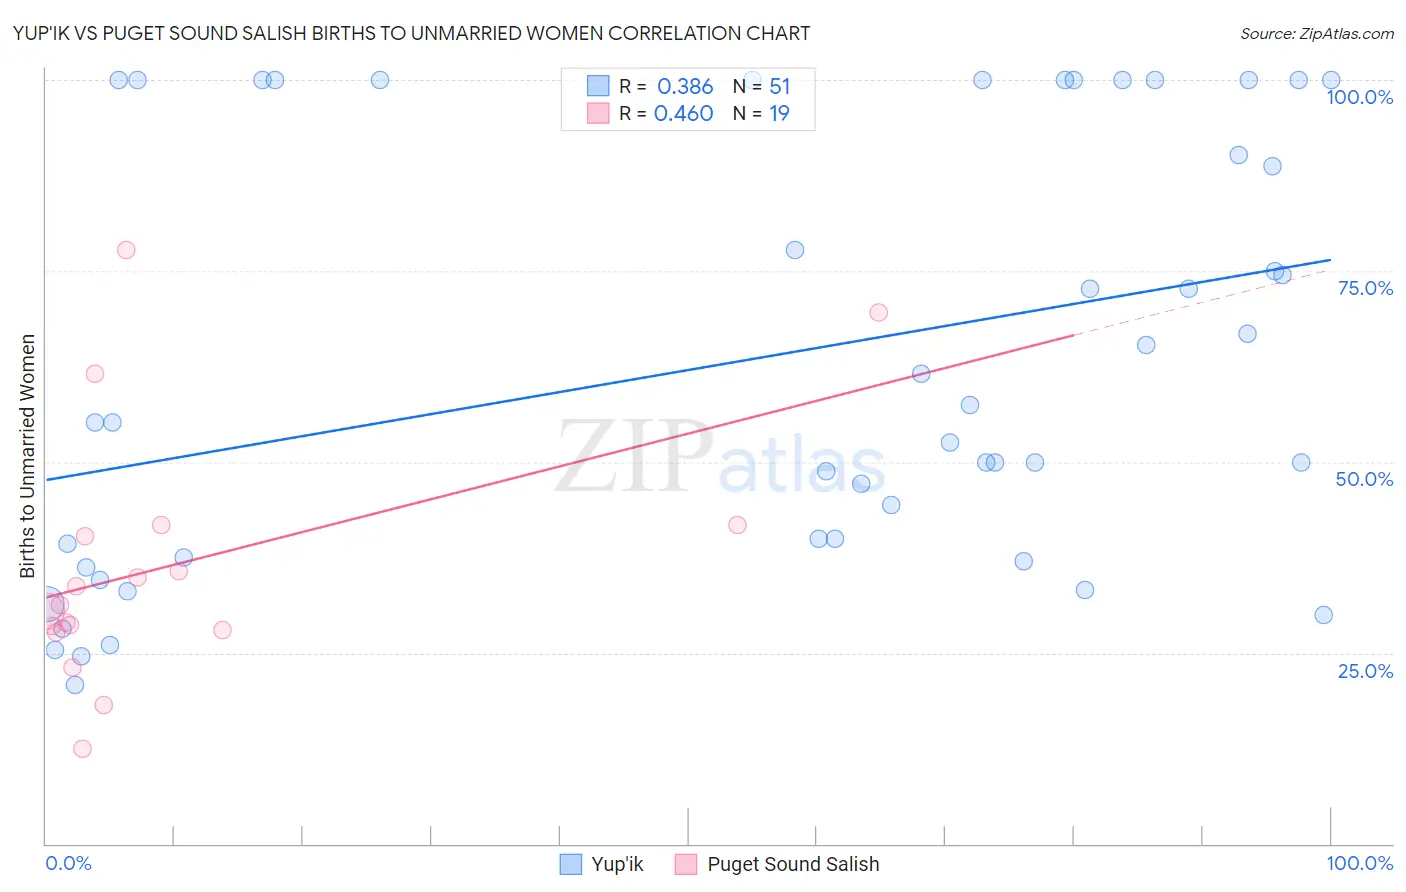
Yup'ik vs Puget Sound Salish Births to Unmarried Women Correlation Chart
The statistical analysis conducted on geographies consisting of 39,414,518 people shows a mild positive correlation between the proportion of Yup'ik and percentage of births to unmarried women in the United States with a correlation coefficient (R) of 0.386 and weighted average of 56.4%. Similarly, the statistical analysis conducted on geographies consisting of 44,862,304 people shows a moderate positive correlation between the proportion of Puget Sound Salish and percentage of births to unmarried women in the United States with a correlation coefficient (R) of 0.460 and weighted average of 30.4%, a difference of 85.4%.
Births to Unmarried Women Correlation Summary
| Measurement | Yup'ik | Puget Sound Salish |
| Minimum | 20.7% | 12.4% |
| Maximum | 100.0% | 77.8% |
| Range | 79.3% | 65.4% |
| Mean | 63.2% | 36.5% |
| Median | 55.2% | 31.3% |
| Interquartile 25% (IQ1) | 37.5% | 28.0% |
| Interquartile 75% (IQ3) | 100.0% | 41.7% |
| Interquartile Range (IQR) | 62.5% | 13.7% |
| Standard Deviation (Sample) | 27.8% | 16.7% |
| Standard Deviation (Population) | 27.5% | 16.2% |
Similar Demographics by Births to Unmarried Women
Demographics Similar to Yup'ik by Births to Unmarried Women
In terms of births to unmarried women, the demographic groups most similar to Yup'ik are Pueblo (53.7%, a difference of 5.2%), Inupiat (52.1%, a difference of 8.3%), Navajo (51.5%, a difference of 9.6%), Pima (51.5%, a difference of 9.6%), and Menominee (51.1%, a difference of 10.4%).
| Demographics | Rating | Rank | Births to Unmarried Women |
| Blacks/African Americans | 0.0 /100 | #333 | Tragic 44.3% |
| Yuman | 0.0 /100 | #334 | Tragic 44.4% |
| Colville | 0.0 /100 | #335 | Tragic 45.3% |
| Puerto Ricans | 0.0 /100 | #336 | Tragic 45.7% |
| Houma | 0.0 /100 | #337 | Tragic 46.6% |
| Arapaho | 0.0 /100 | #338 | Tragic 47.1% |
| Lumbee | 0.0 /100 | #339 | Tragic 48.2% |
| Tohono O'odham | 0.0 /100 | #340 | Tragic 49.8% |
| Hopi | 0.0 /100 | #341 | Tragic 50.8% |
| Menominee | 0.0 /100 | #342 | Tragic 51.1% |
| Pima | 0.0 /100 | #343 | Tragic 51.5% |
| Navajo | 0.0 /100 | #344 | Tragic 51.5% |
| Inupiat | 0.0 /100 | #345 | Tragic 52.1% |
| Pueblo | 0.0 /100 | #346 | Tragic 53.7% |
| Yup'ik | 0.0 /100 | #347 | Tragic 56.4% |
Demographics Similar to Puget Sound Salish by Births to Unmarried Women
In terms of births to unmarried women, the demographic groups most similar to Puget Sound Salish are Immigrants from Philippines (30.4%, a difference of 0.0%), Immigrants from Canada (30.4%, a difference of 0.030%), Immigrants from Scotland (30.4%, a difference of 0.13%), Swiss (30.5%, a difference of 0.14%), and Pakistani (30.5%, a difference of 0.16%).
| Demographics | Rating | Rank | Births to Unmarried Women |
| Immigrants | Zimbabwe | 85.7 /100 | #131 | Excellent 30.3% |
| New Zealanders | 85.5 /100 | #132 | Excellent 30.3% |
| Immigrants | Morocco | 85.2 /100 | #133 | Excellent 30.4% |
| Immigrants | South Eastern Asia | 85.2 /100 | #134 | Excellent 30.4% |
| Brazilians | 84.8 /100 | #135 | Excellent 30.4% |
| Immigrants | Scotland | 84.6 /100 | #136 | Excellent 30.4% |
| Immigrants | Philippines | 83.9 /100 | #137 | Excellent 30.4% |
| Puget Sound Salish | 83.9 /100 | #138 | Excellent 30.4% |
| Immigrants | Canada | 83.7 /100 | #139 | Excellent 30.4% |
| Swiss | 83.1 /100 | #140 | Excellent 30.5% |
| Pakistanis | 83.0 /100 | #141 | Excellent 30.5% |
| South Africans | 82.7 /100 | #142 | Excellent 30.5% |
| Immigrants | Uganda | 82.6 /100 | #143 | Excellent 30.5% |
| Czechs | 82.1 /100 | #144 | Excellent 30.5% |
| Immigrants | North America | 81.5 /100 | #145 | Excellent 30.6% |