Serbian vs Puget Sound Salish Births to Unmarried Women
COMPARE
Serbian
Puget Sound Salish
Births to Unmarried Women
Births to Unmarried Women Comparison
Serbians
Puget Sound Salish
30.7%
BIRTHS TO UNMARRIED WOMEN
78.8/ 100
METRIC RATING
149th/ 347
METRIC RANK
30.4%
BIRTHS TO UNMARRIED WOMEN
83.9/ 100
METRIC RATING
138th/ 347
METRIC RANK
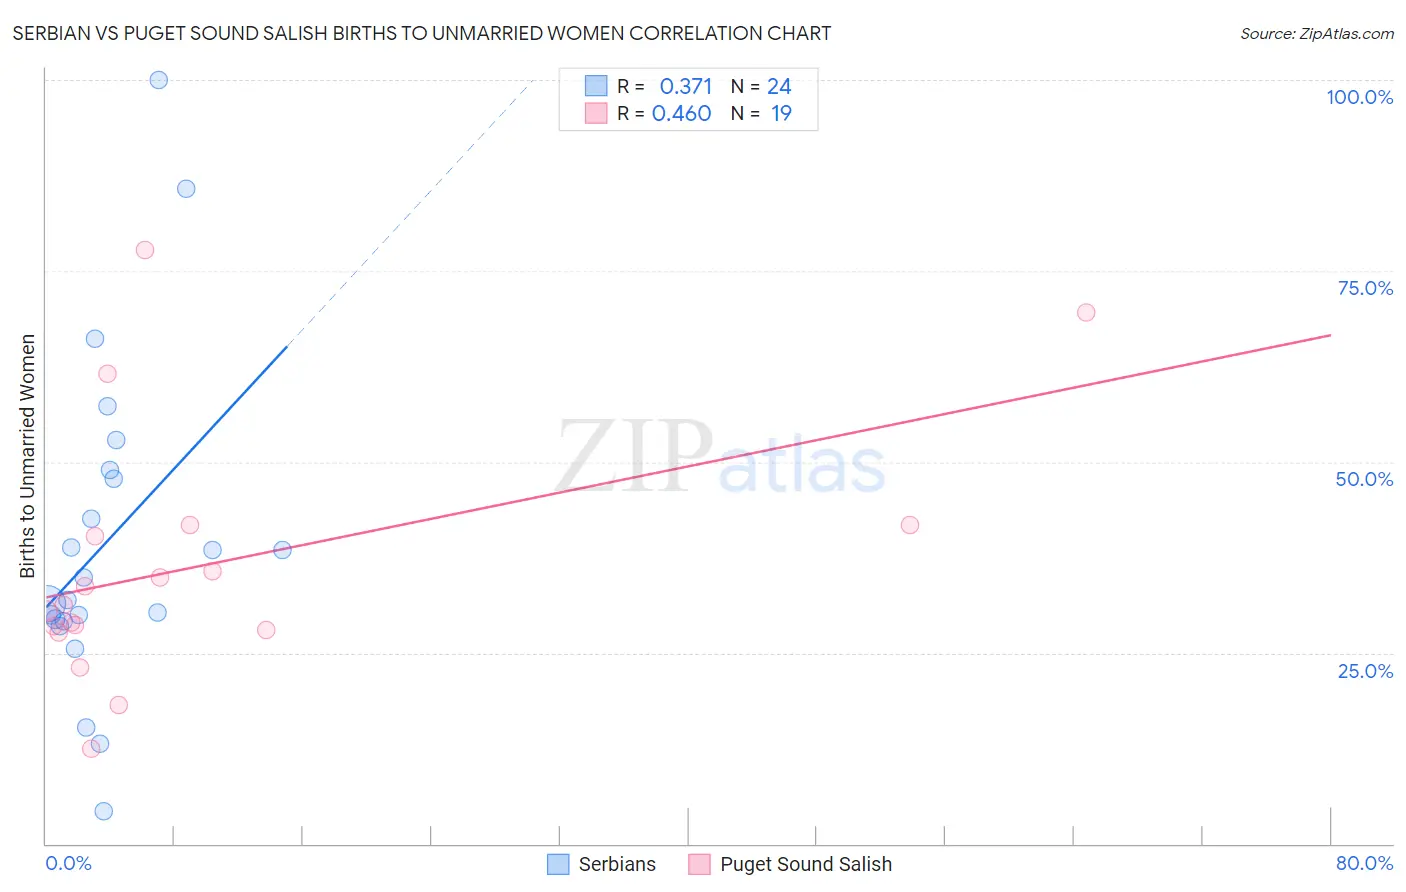
Serbian vs Puget Sound Salish Births to Unmarried Women Correlation Chart
The statistical analysis conducted on geographies consisting of 251,582,376 people shows a mild positive correlation between the proportion of Serbians and percentage of births to unmarried women in the United States with a correlation coefficient (R) of 0.371 and weighted average of 30.7%. Similarly, the statistical analysis conducted on geographies consisting of 44,862,304 people shows a moderate positive correlation between the proportion of Puget Sound Salish and percentage of births to unmarried women in the United States with a correlation coefficient (R) of 0.460 and weighted average of 30.4%, a difference of 0.84%.
Births to Unmarried Women Correlation Summary
| Measurement | Serbian | Puget Sound Salish |
| Minimum | 4.2% | 12.4% |
| Maximum | 100.0% | 77.8% |
| Range | 95.8% | 65.4% |
| Mean | 39.6% | 36.5% |
| Median | 33.4% | 31.3% |
| Interquartile 25% (IQ1) | 29.3% | 28.0% |
| Interquartile 75% (IQ3) | 48.4% | 41.7% |
| Interquartile Range (IQR) | 19.1% | 13.7% |
| Standard Deviation (Sample) | 21.5% | 16.7% |
| Standard Deviation (Population) | 21.1% | 16.2% |
Demographics Similar to Serbians and Puget Sound Salish by Births to Unmarried Women
In terms of births to unmarried women, the demographic groups most similar to Serbians are Chilean (30.7%, a difference of 0.040%), Somali (30.7%, a difference of 0.14%), Italian (30.8%, a difference of 0.26%), Polish (30.8%, a difference of 0.36%), and Immigrants from Oceania (30.6%, a difference of 0.37%). Similarly, the demographic groups most similar to Puget Sound Salish are Immigrants from Philippines (30.4%, a difference of 0.0%), Immigrants from Canada (30.4%, a difference of 0.030%), Immigrants from Scotland (30.4%, a difference of 0.13%), Swiss (30.5%, a difference of 0.14%), and Pakistani (30.5%, a difference of 0.16%).
| Demographics | Rating | Rank | Births to Unmarried Women |
| Immigrants | Morocco | 85.2 /100 | #133 | Excellent 30.4% |
| Immigrants | South Eastern Asia | 85.2 /100 | #134 | Excellent 30.4% |
| Brazilians | 84.8 /100 | #135 | Excellent 30.4% |
| Immigrants | Scotland | 84.6 /100 | #136 | Excellent 30.4% |
| Immigrants | Philippines | 83.9 /100 | #137 | Excellent 30.4% |
| Puget Sound Salish | 83.9 /100 | #138 | Excellent 30.4% |
| Immigrants | Canada | 83.7 /100 | #139 | Excellent 30.4% |
| Swiss | 83.1 /100 | #140 | Excellent 30.5% |
| Pakistanis | 83.0 /100 | #141 | Excellent 30.5% |
| South Africans | 82.7 /100 | #142 | Excellent 30.5% |
| Immigrants | Uganda | 82.6 /100 | #143 | Excellent 30.5% |
| Czechs | 82.1 /100 | #144 | Excellent 30.5% |
| Immigrants | North America | 81.5 /100 | #145 | Excellent 30.6% |
| Northern Europeans | 81.4 /100 | #146 | Excellent 30.6% |
| Immigrants | Oceania | 81.2 /100 | #147 | Excellent 30.6% |
| Chileans | 79.1 /100 | #148 | Good 30.7% |
| Serbians | 78.8 /100 | #149 | Good 30.7% |
| Somalis | 77.8 /100 | #150 | Good 30.7% |
| Italians | 77.0 /100 | #151 | Good 30.8% |
| Poles | 76.2 /100 | #152 | Good 30.8% |
| British | 76.0 /100 | #153 | Good 30.8% |