Croatian vs Puget Sound Salish Births to Unmarried Women
COMPARE
Croatian
Puget Sound Salish
Births to Unmarried Women
Births to Unmarried Women Comparison
Croatians
Puget Sound Salish
30.2%
BIRTHS TO UNMARRIED WOMEN
88.0/ 100
METRIC RATING
124th/ 347
METRIC RANK
30.4%
BIRTHS TO UNMARRIED WOMEN
83.9/ 100
METRIC RATING
138th/ 347
METRIC RANK
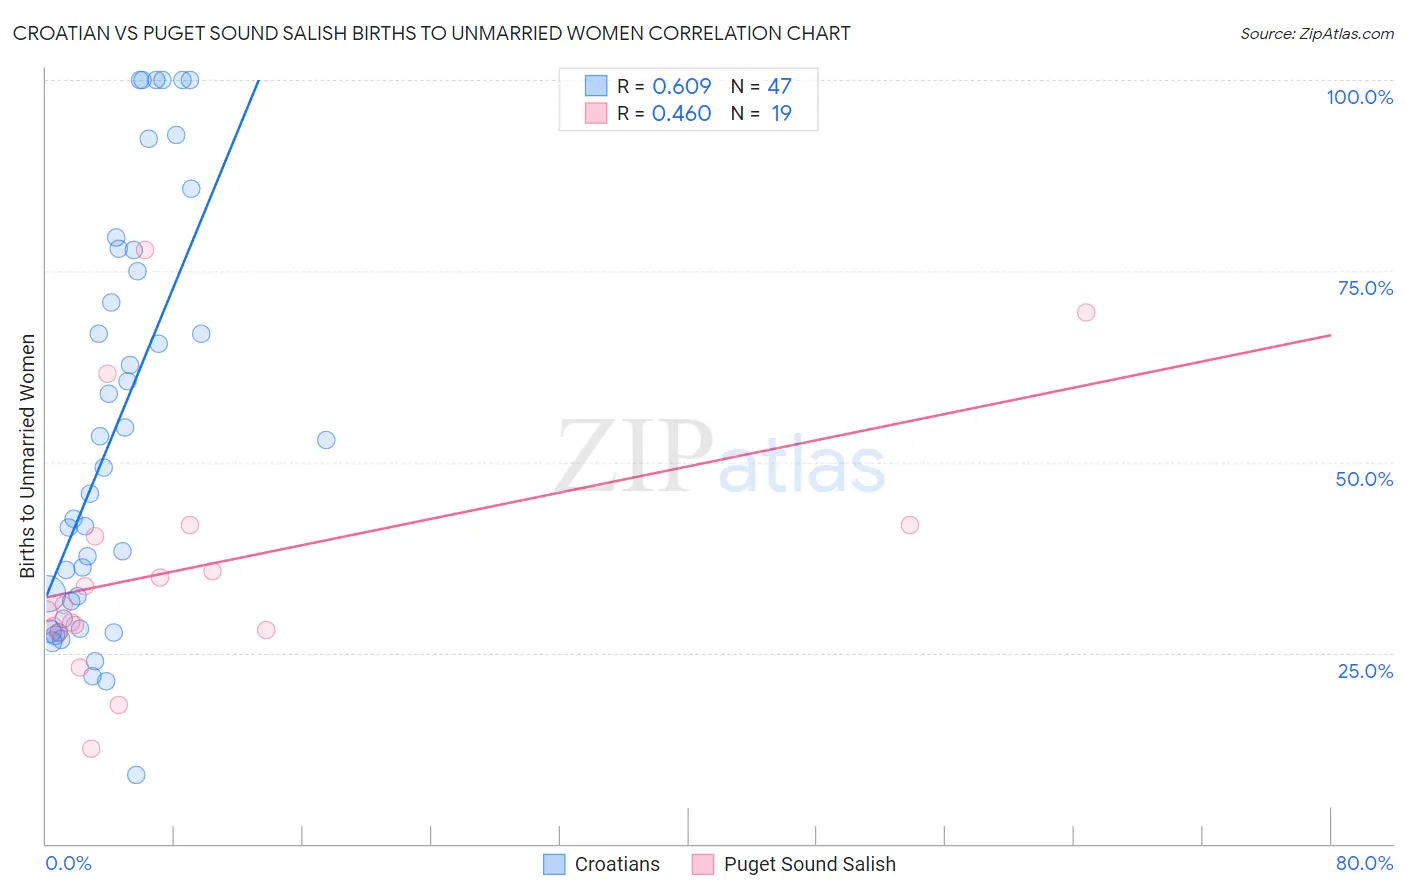
Croatian vs Puget Sound Salish Births to Unmarried Women Correlation Chart
The statistical analysis conducted on geographies consisting of 347,705,559 people shows a significant positive correlation between the proportion of Croatians and percentage of births to unmarried women in the United States with a correlation coefficient (R) of 0.609 and weighted average of 30.2%. Similarly, the statistical analysis conducted on geographies consisting of 44,862,304 people shows a moderate positive correlation between the proportion of Puget Sound Salish and percentage of births to unmarried women in the United States with a correlation coefficient (R) of 0.460 and weighted average of 30.4%, a difference of 0.85%.
Births to Unmarried Women Correlation Summary
| Measurement | Croatian | Puget Sound Salish |
| Minimum | 9.0% | 12.4% |
| Maximum | 100.0% | 77.8% |
| Range | 91.0% | 65.4% |
| Mean | 54.4% | 36.5% |
| Median | 49.3% | 31.3% |
| Interquartile 25% (IQ1) | 29.4% | 28.0% |
| Interquartile 75% (IQ3) | 77.8% | 41.7% |
| Interquartile Range (IQR) | 48.4% | 13.7% |
| Standard Deviation (Sample) | 27.0% | 16.7% |
| Standard Deviation (Population) | 26.7% | 16.2% |
Demographics Similar to Croatians and Puget Sound Salish by Births to Unmarried Women
In terms of births to unmarried women, the demographic groups most similar to Croatians are Syrian (30.2%, a difference of 0.040%), Vietnamese (30.2%, a difference of 0.070%), Immigrants from Argentina (30.1%, a difference of 0.17%), European (30.2%, a difference of 0.19%), and Korean (30.1%, a difference of 0.21%). Similarly, the demographic groups most similar to Puget Sound Salish are Immigrants from Philippines (30.4%, a difference of 0.0%), Immigrants from Canada (30.4%, a difference of 0.030%), Immigrants from Scotland (30.4%, a difference of 0.13%), Swiss (30.5%, a difference of 0.14%), and Pakistani (30.5%, a difference of 0.16%).
| Demographics | Rating | Rank | Births to Unmarried Women |
| Koreans | 88.9 /100 | #121 | Excellent 30.1% |
| Immigrants | Argentina | 88.7 /100 | #122 | Excellent 30.1% |
| Syrians | 88.2 /100 | #123 | Excellent 30.2% |
| Croatians | 88.0 /100 | #124 | Excellent 30.2% |
| Vietnamese | 87.7 /100 | #125 | Excellent 30.2% |
| Europeans | 87.2 /100 | #126 | Excellent 30.2% |
| Chinese | 87.1 /100 | #127 | Excellent 30.2% |
| Icelanders | 86.0 /100 | #128 | Excellent 30.3% |
| Immigrants | Spain | 85.8 /100 | #129 | Excellent 30.3% |
| Immigrants | Bosnia and Herzegovina | 85.7 /100 | #130 | Excellent 30.3% |
| Immigrants | Zimbabwe | 85.7 /100 | #131 | Excellent 30.3% |
| New Zealanders | 85.5 /100 | #132 | Excellent 30.3% |
| Immigrants | Morocco | 85.2 /100 | #133 | Excellent 30.4% |
| Immigrants | South Eastern Asia | 85.2 /100 | #134 | Excellent 30.4% |
| Brazilians | 84.8 /100 | #135 | Excellent 30.4% |
| Immigrants | Scotland | 84.6 /100 | #136 | Excellent 30.4% |
| Immigrants | Philippines | 83.9 /100 | #137 | Excellent 30.4% |
| Puget Sound Salish | 83.9 /100 | #138 | Excellent 30.4% |
| Immigrants | Canada | 83.7 /100 | #139 | Excellent 30.4% |
| Swiss | 83.1 /100 | #140 | Excellent 30.5% |
| Pakistanis | 83.0 /100 | #141 | Excellent 30.5% |