Yup'ik vs Puget Sound Salish Median Female Earnings
COMPARE
Yup'ik
Puget Sound Salish
Median Female Earnings
Median Female Earnings Comparison
Yup'ik
Puget Sound Salish
$32,730
MEDIAN FEMALE EARNINGS
0.0/ 100
METRIC RATING
342nd/ 347
METRIC RANK
$39,376
MEDIAN FEMALE EARNINGS
33.9/ 100
METRIC RATING
190th/ 347
METRIC RANK
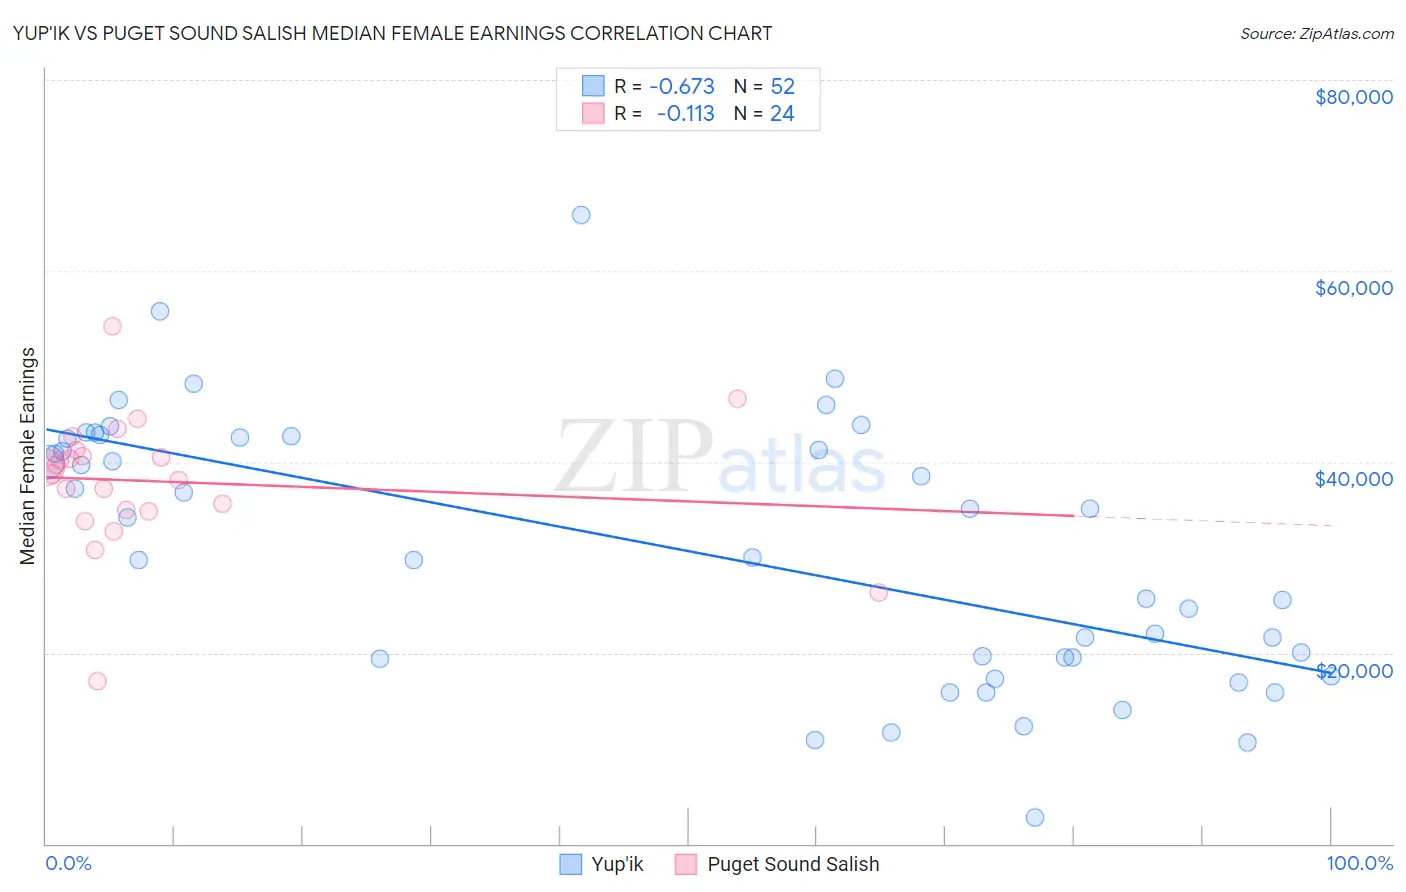
Yup'ik vs Puget Sound Salish Median Female Earnings Correlation Chart
The statistical analysis conducted on geographies consisting of 39,946,861 people shows a significant negative correlation between the proportion of Yup'ik and median female earnings in the United States with a correlation coefficient (R) of -0.673 and weighted average of $32,730. Similarly, the statistical analysis conducted on geographies consisting of 46,146,789 people shows a poor negative correlation between the proportion of Puget Sound Salish and median female earnings in the United States with a correlation coefficient (R) of -0.113 and weighted average of $39,376, a difference of 20.3%.
Median Female Earnings Correlation Summary
| Measurement | Yup'ik | Puget Sound Salish |
| Minimum | $2,800 | $17,028 |
| Maximum | $65,833 | $54,167 |
| Range | $63,033 | $37,139 |
| Mean | $30,861 | $37,933 |
| Median | $32,085 | $39,067 |
| Interquartile 25% (IQ1) | $19,410 | $34,884 |
| Interquartile 75% (IQ3) | $42,445 | $40,976 |
| Interquartile Range (IQR) | $23,035 | $6,092 |
| Standard Deviation (Sample) | $13,771 | $7,122 |
| Standard Deviation (Population) | $13,638 | $6,972 |
Similar Demographics by Median Female Earnings
Demographics Similar to Yup'ik by Median Female Earnings
In terms of median female earnings, the demographic groups most similar to Yup'ik are Pueblo ($32,564, a difference of 0.51%), Lumbee ($32,500, a difference of 0.71%), Navajo ($33,046, a difference of 0.96%), Tohono O'odham ($33,205, a difference of 1.5%), and Immigrants from Mexico ($33,236, a difference of 1.5%).
| Demographics | Rating | Rank | Median Female Earnings |
| Mexicans | 0.0 /100 | #333 | Tragic $33,664 |
| Spanish American Indians | 0.0 /100 | #334 | Tragic $33,625 |
| Creek | 0.0 /100 | #335 | Tragic $33,437 |
| Ottawa | 0.0 /100 | #336 | Tragic $33,378 |
| Yakama | 0.0 /100 | #337 | Tragic $33,354 |
| Immigrants | Cuba | 0.0 /100 | #338 | Tragic $33,291 |
| Immigrants | Mexico | 0.0 /100 | #339 | Tragic $33,236 |
| Tohono O'odham | 0.0 /100 | #340 | Tragic $33,205 |
| Navajo | 0.0 /100 | #341 | Tragic $33,046 |
| Yup'ik | 0.0 /100 | #342 | Tragic $32,730 |
| Pueblo | 0.0 /100 | #343 | Tragic $32,564 |
| Lumbee | 0.0 /100 | #344 | Tragic $32,500 |
| Puerto Ricans | 0.0 /100 | #345 | Tragic $31,560 |
| Arapaho | 0.0 /100 | #346 | Tragic $31,489 |
| Houma | 0.0 /100 | #347 | Tragic $30,343 |
Demographics Similar to Puget Sound Salish by Median Female Earnings
In terms of median female earnings, the demographic groups most similar to Puget Sound Salish are Senegalese ($39,384, a difference of 0.020%), Immigrants from Western Africa ($39,351, a difference of 0.060%), Swedish ($39,421, a difference of 0.11%), Bermudan ($39,418, a difference of 0.11%), and Immigrants ($39,328, a difference of 0.12%).
| Demographics | Rating | Rank | Median Female Earnings |
| Hungarians | 40.3 /100 | #183 | Average $39,510 |
| Europeans | 37.7 /100 | #184 | Fair $39,457 |
| Immigrants | West Indies | 36.9 /100 | #185 | Fair $39,441 |
| Colombians | 36.9 /100 | #186 | Fair $39,439 |
| Swedes | 36.0 /100 | #187 | Fair $39,421 |
| Bermudans | 35.9 /100 | #188 | Fair $39,418 |
| Senegalese | 34.2 /100 | #189 | Fair $39,384 |
| Puget Sound Salish | 33.9 /100 | #190 | Fair $39,376 |
| Immigrants | Western Africa | 32.7 /100 | #191 | Fair $39,351 |
| Immigrants | Immigrants | 31.7 /100 | #192 | Fair $39,328 |
| Immigrants | Nigeria | 30.2 /100 | #193 | Fair $39,294 |
| Irish | 30.0 /100 | #194 | Fair $39,291 |
| Uruguayans | 27.3 /100 | #195 | Fair $39,228 |
| Immigrants | Costa Rica | 25.6 /100 | #196 | Fair $39,186 |
| Assyrians/Chaldeans/Syriacs | 24.6 /100 | #197 | Fair $39,159 |