Yup'ik vs Immigrants from Austria Births to Unmarried Women
COMPARE
Yup'ik
Immigrants from Austria
Births to Unmarried Women
Births to Unmarried Women Comparison
Yup'ik
Immigrants from Austria
56.4%
BIRTHS TO UNMARRIED WOMEN
0.0/ 100
METRIC RATING
347th/ 347
METRIC RANK
28.7%
BIRTHS TO UNMARRIED WOMEN
98.1/ 100
METRIC RATING
81st/ 347
METRIC RANK
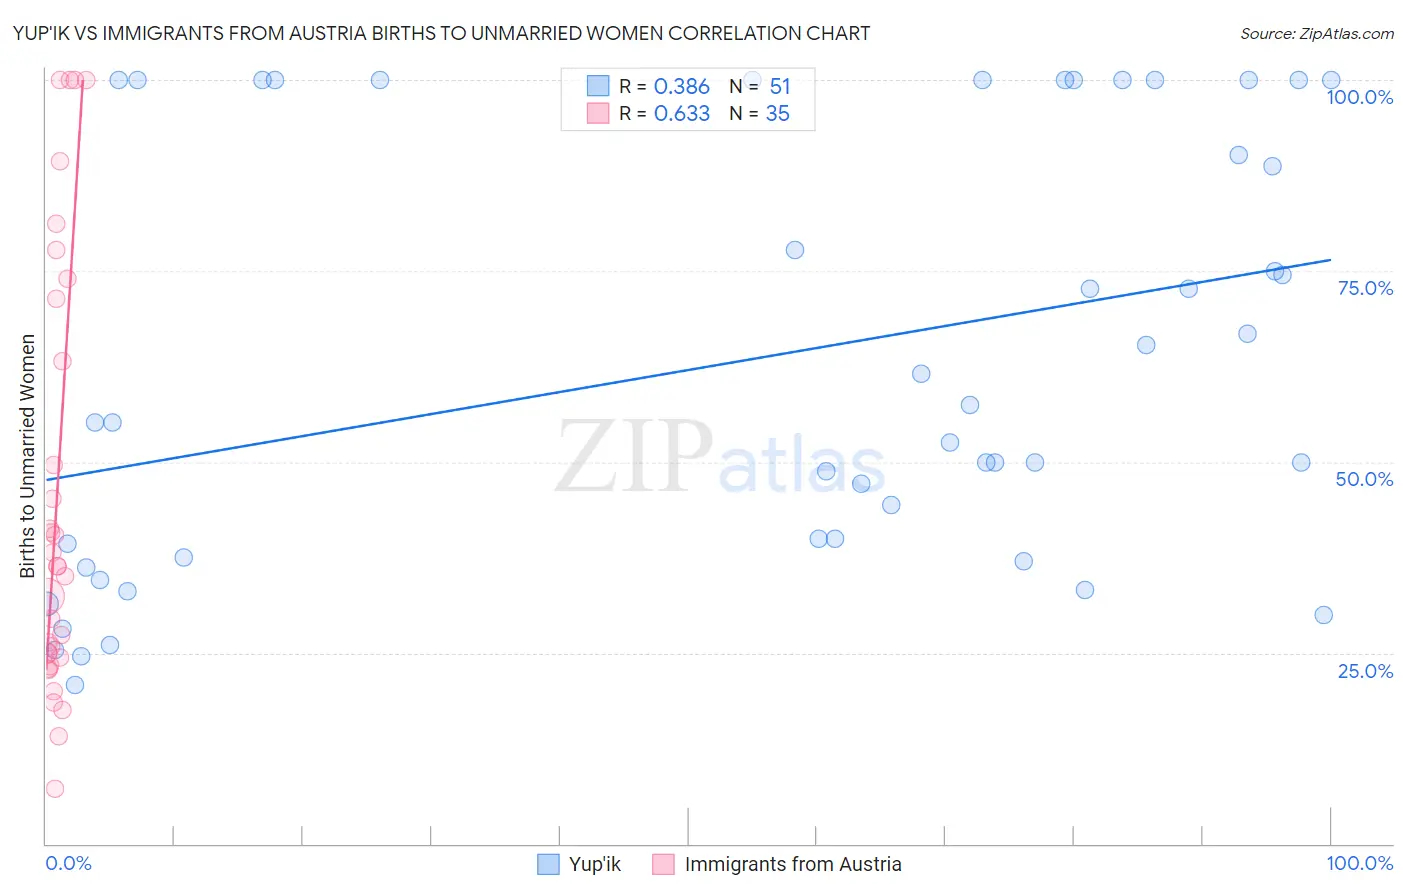
Yup'ik vs Immigrants from Austria Births to Unmarried Women Correlation Chart
The statistical analysis conducted on geographies consisting of 39,414,518 people shows a mild positive correlation between the proportion of Yup'ik and percentage of births to unmarried women in the United States with a correlation coefficient (R) of 0.386 and weighted average of 56.4%. Similarly, the statistical analysis conducted on geographies consisting of 159,179,999 people shows a significant positive correlation between the proportion of Immigrants from Austria and percentage of births to unmarried women in the United States with a correlation coefficient (R) of 0.633 and weighted average of 28.7%, a difference of 96.5%.
Births to Unmarried Women Correlation Summary
| Measurement | Yup'ik | Immigrants from Austria |
| Minimum | 20.7% | 7.2% |
| Maximum | 100.0% | 100.0% |
| Range | 79.3% | 92.8% |
| Mean | 63.2% | 45.2% |
| Median | 55.2% | 36.4% |
| Interquartile 25% (IQ1) | 37.5% | 24.4% |
| Interquartile 75% (IQ3) | 100.0% | 71.3% |
| Interquartile Range (IQR) | 62.5% | 46.9% |
| Standard Deviation (Sample) | 27.8% | 28.3% |
| Standard Deviation (Population) | 27.5% | 27.9% |
Similar Demographics by Births to Unmarried Women
Demographics Similar to Yup'ik by Births to Unmarried Women
In terms of births to unmarried women, the demographic groups most similar to Yup'ik are Pueblo (53.7%, a difference of 5.2%), Inupiat (52.1%, a difference of 8.3%), Navajo (51.5%, a difference of 9.6%), Pima (51.5%, a difference of 9.6%), and Menominee (51.1%, a difference of 10.4%).
| Demographics | Rating | Rank | Births to Unmarried Women |
| Blacks/African Americans | 0.0 /100 | #333 | Tragic 44.3% |
| Yuman | 0.0 /100 | #334 | Tragic 44.4% |
| Colville | 0.0 /100 | #335 | Tragic 45.3% |
| Puerto Ricans | 0.0 /100 | #336 | Tragic 45.7% |
| Houma | 0.0 /100 | #337 | Tragic 46.6% |
| Arapaho | 0.0 /100 | #338 | Tragic 47.1% |
| Lumbee | 0.0 /100 | #339 | Tragic 48.2% |
| Tohono O'odham | 0.0 /100 | #340 | Tragic 49.8% |
| Hopi | 0.0 /100 | #341 | Tragic 50.8% |
| Menominee | 0.0 /100 | #342 | Tragic 51.1% |
| Pima | 0.0 /100 | #343 | Tragic 51.5% |
| Navajo | 0.0 /100 | #344 | Tragic 51.5% |
| Inupiat | 0.0 /100 | #345 | Tragic 52.1% |
| Pueblo | 0.0 /100 | #346 | Tragic 53.7% |
| Yup'ik | 0.0 /100 | #347 | Tragic 56.4% |
Demographics Similar to Immigrants from Austria by Births to Unmarried Women
In terms of births to unmarried women, the demographic groups most similar to Immigrants from Austria are Immigrants from Afghanistan (28.7%, a difference of 0.040%), Danish (28.7%, a difference of 0.070%), Zimbabwean (28.7%, a difference of 0.090%), Romanian (28.7%, a difference of 0.11%), and Immigrants from Kuwait (28.8%, a difference of 0.18%).
| Demographics | Rating | Rank | Births to Unmarried Women |
| Immigrants | Bolivia | 98.5 /100 | #74 | Exceptional 28.6% |
| Immigrants | Switzerland | 98.4 /100 | #75 | Exceptional 28.6% |
| Israelis | 98.4 /100 | #76 | Exceptional 28.6% |
| Immigrants | Northern Europe | 98.3 /100 | #77 | Exceptional 28.6% |
| Zimbabweans | 98.2 /100 | #78 | Exceptional 28.7% |
| Danes | 98.2 /100 | #79 | Exceptional 28.7% |
| Immigrants | Afghanistan | 98.1 /100 | #80 | Exceptional 28.7% |
| Immigrants | Austria | 98.1 /100 | #81 | Exceptional 28.7% |
| Romanians | 98.0 /100 | #82 | Exceptional 28.7% |
| Immigrants | Kuwait | 98.0 /100 | #83 | Exceptional 28.8% |
| Immigrants | Poland | 97.6 /100 | #84 | Exceptional 28.9% |
| Sri Lankans | 97.5 /100 | #85 | Exceptional 28.9% |
| Immigrants | Jordan | 97.4 /100 | #86 | Exceptional 29.0% |
| Taiwanese | 97.3 /100 | #87 | Exceptional 29.0% |
| Immigrants | France | 97.3 /100 | #88 | Exceptional 29.0% |