Yup'ik vs Puget Sound Salish In Labor Force | Age 20-24
COMPARE
Yup'ik
Puget Sound Salish
In Labor Force | Age 20-24
In Labor Force | Age 20-24 Comparison
Yup'ik
Puget Sound Salish
70.9%
IN LABOR FORCE | AGE 20-24
0.0/ 100
METRIC RATING
329th/ 347
METRIC RANK
78.0%
IN LABOR FORCE | AGE 20-24
100.0/ 100
METRIC RATING
21st/ 347
METRIC RANK
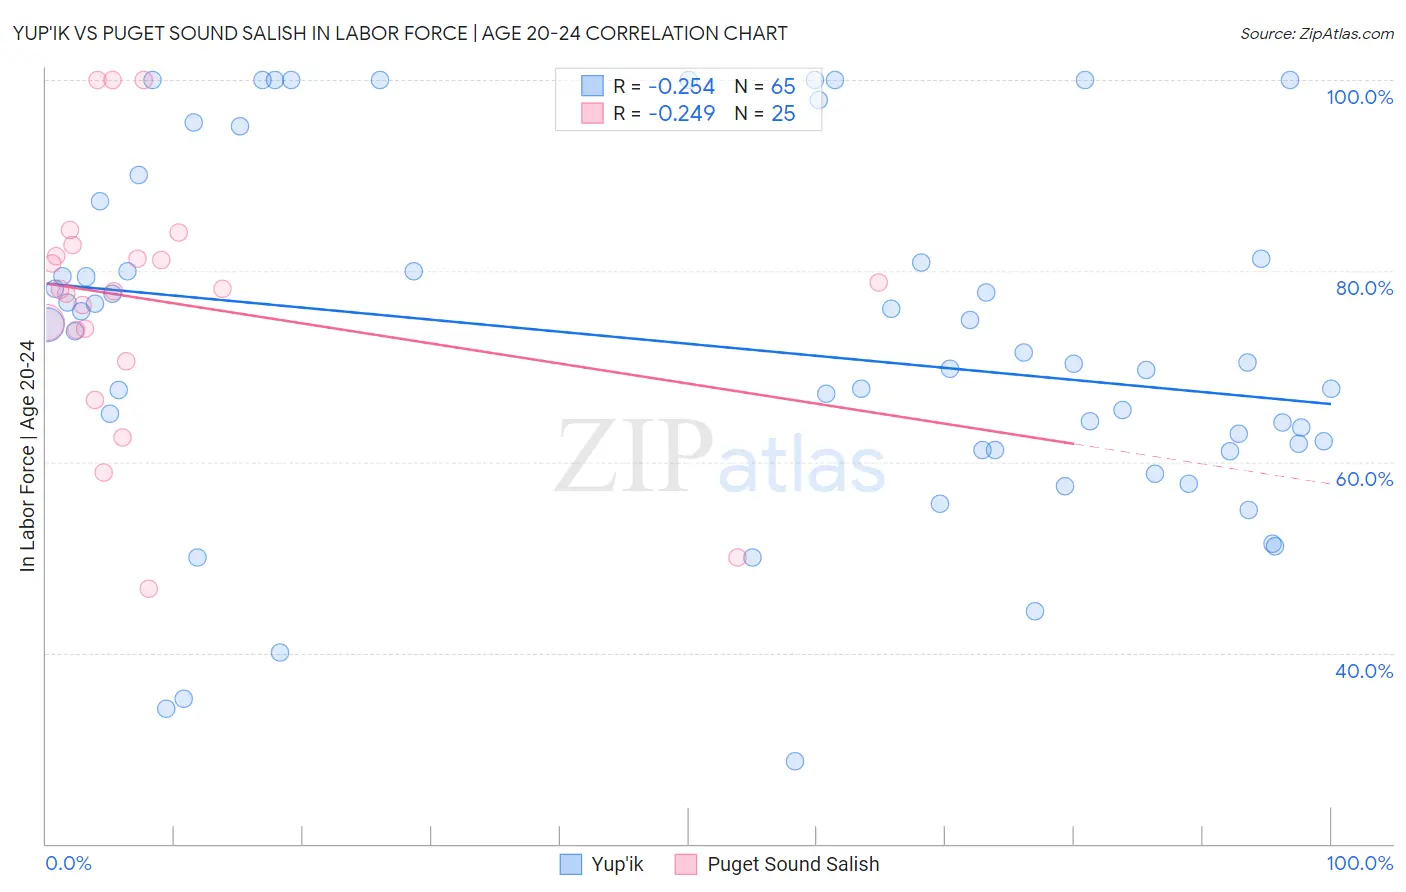
Yup'ik vs Puget Sound Salish In Labor Force | Age 20-24 Correlation Chart
The statistical analysis conducted on geographies consisting of 39,958,192 people shows a weak negative correlation between the proportion of Yup'ik and labor force participation rate among population between the ages 20 and 24 in the United States with a correlation coefficient (R) of -0.254 and weighted average of 70.9%. Similarly, the statistical analysis conducted on geographies consisting of 46,155,398 people shows a weak negative correlation between the proportion of Puget Sound Salish and labor force participation rate among population between the ages 20 and 24 in the United States with a correlation coefficient (R) of -0.249 and weighted average of 78.0%, a difference of 10.1%.
In Labor Force | Age 20-24 Correlation Summary
| Measurement | Yup'ik | Puget Sound Salish |
| Minimum | 28.6% | 46.7% |
| Maximum | 100.0% | 100.0% |
| Range | 71.4% | 53.3% |
| Mean | 72.2% | 76.8% |
| Median | 70.4% | 78.1% |
| Interquartile 25% (IQ1) | 61.3% | 72.2% |
| Interquartile 75% (IQ3) | 81.1% | 82.1% |
| Interquartile Range (IQR) | 19.8% | 9.9% |
| Standard Deviation (Sample) | 18.2% | 13.2% |
| Standard Deviation (Population) | 18.1% | 12.9% |
Similar Demographics by In Labor Force | Age 20-24
Demographics Similar to Yup'ik by In Labor Force | Age 20-24
In terms of in labor force | age 20-24, the demographic groups most similar to Yup'ik are Immigrants from China (71.1%, a difference of 0.24%), Dominican (71.1%, a difference of 0.26%), Immigrants from Trinidad and Tobago (71.1%, a difference of 0.26%), Barbadian (71.1%, a difference of 0.35%), and Vietnamese (70.6%, a difference of 0.35%).
| Demographics | Rating | Rank | In Labor Force | Age 20-24 |
| Filipinos | 0.0 /100 | #322 | Tragic 71.4% |
| West Indians | 0.0 /100 | #323 | Tragic 71.3% |
| Immigrants | Dominican Republic | 0.0 /100 | #324 | Tragic 71.2% |
| Barbadians | 0.0 /100 | #325 | Tragic 71.1% |
| Dominicans | 0.0 /100 | #326 | Tragic 71.1% |
| Immigrants | Trinidad and Tobago | 0.0 /100 | #327 | Tragic 71.1% |
| Immigrants | China | 0.0 /100 | #328 | Tragic 71.1% |
| Yup'ik | 0.0 /100 | #329 | Tragic 70.9% |
| Vietnamese | 0.0 /100 | #330 | Tragic 70.6% |
| Immigrants | Bangladesh | 0.0 /100 | #331 | Tragic 70.6% |
| Immigrants | Uzbekistan | 0.0 /100 | #332 | Tragic 70.4% |
| Yuman | 0.0 /100 | #333 | Tragic 70.3% |
| British West Indians | 0.0 /100 | #334 | Tragic 70.0% |
| Immigrants | Barbados | 0.0 /100 | #335 | Tragic 69.7% |
| Immigrants | Guyana | 0.0 /100 | #336 | Tragic 69.3% |
Demographics Similar to Puget Sound Salish by In Labor Force | Age 20-24
In terms of in labor force | age 20-24, the demographic groups most similar to Puget Sound Salish are Pennsylvania German (78.0%, a difference of 0.060%), French Canadian (78.1%, a difference of 0.070%), Yugoslavian (78.0%, a difference of 0.070%), Liberian (78.0%, a difference of 0.070%), and Tlingit-Haida (77.9%, a difference of 0.11%).
| Demographics | Rating | Rank | In Labor Force | Age 20-24 |
| Czechs | 100.0 /100 | #14 | Exceptional 78.5% |
| Sudanese | 100.0 /100 | #15 | Exceptional 78.4% |
| Dutch | 100.0 /100 | #16 | Exceptional 78.4% |
| Cape Verdeans | 100.0 /100 | #17 | Exceptional 78.3% |
| Immigrants | Bosnia and Herzegovina | 100.0 /100 | #18 | Exceptional 78.1% |
| Bangladeshis | 100.0 /100 | #19 | Exceptional 78.1% |
| French Canadians | 100.0 /100 | #20 | Exceptional 78.1% |
| Puget Sound Salish | 100.0 /100 | #21 | Exceptional 78.0% |
| Pennsylvania Germans | 100.0 /100 | #22 | Exceptional 78.0% |
| Yugoslavians | 100.0 /100 | #23 | Exceptional 78.0% |
| Liberians | 100.0 /100 | #24 | Exceptional 78.0% |
| Tlingit-Haida | 100.0 /100 | #25 | Exceptional 77.9% |
| Tongans | 100.0 /100 | #26 | Exceptional 77.9% |
| Immigrants | Micronesia | 100.0 /100 | #27 | Exceptional 77.8% |
| Belgians | 100.0 /100 | #28 | Exceptional 77.8% |