Yuman vs Nicaraguan Married-couple Households
COMPARE
Yuman
Nicaraguan
Married-couple Households
Married-couple Households Comparison
Yuman
Nicaraguans
43.3%
MARRIED-COUPLE HOUSEHOLDS
0.1/ 100
METRIC RATING
270th/ 347
METRIC RANK
45.2%
MARRIED-COUPLE HOUSEHOLDS
5.3/ 100
METRIC RATING
219th/ 347
METRIC RANK
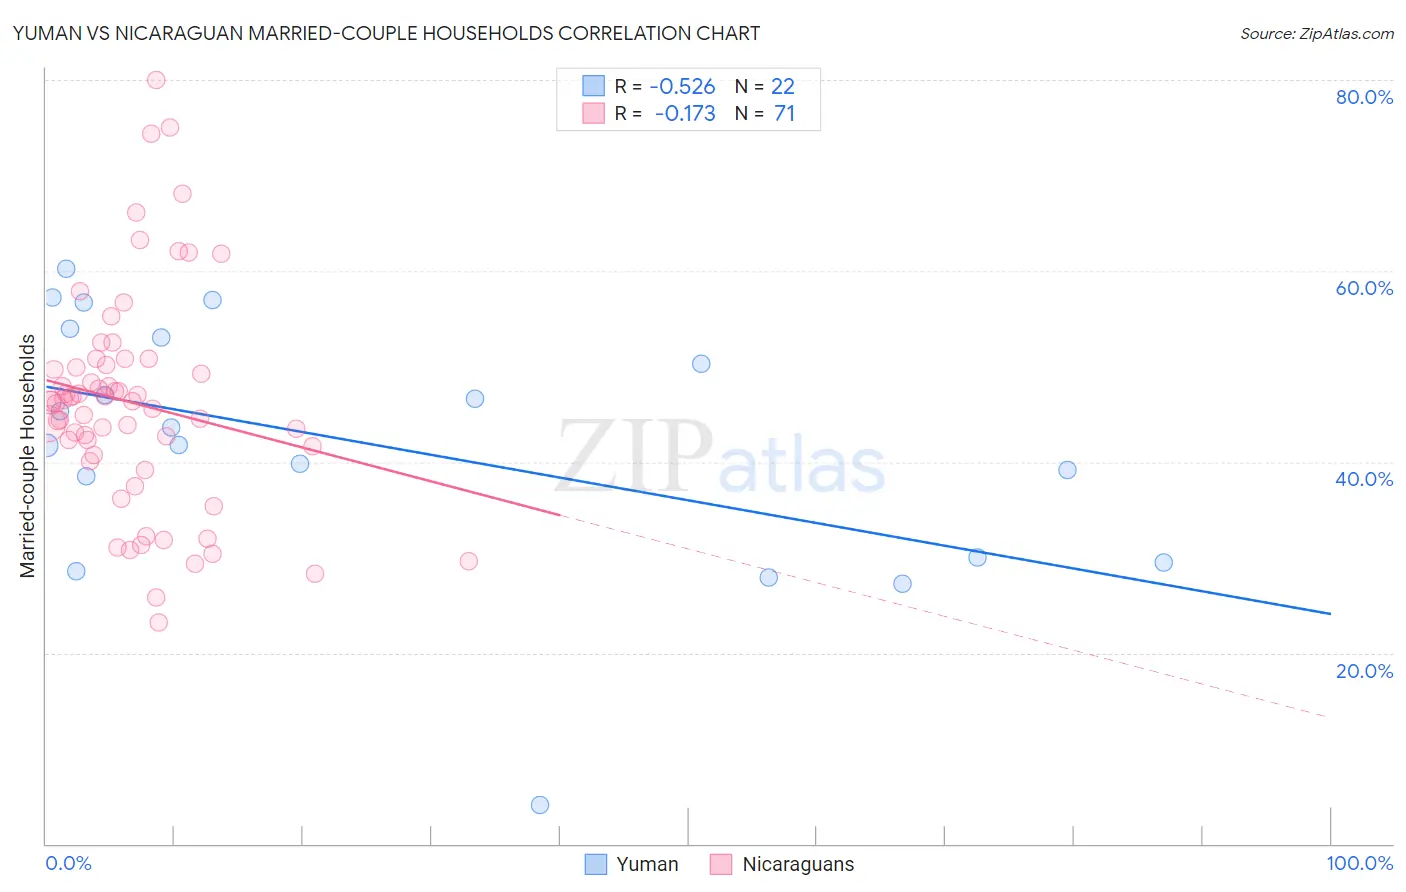
Yuman vs Nicaraguan Married-couple Households Correlation Chart
The statistical analysis conducted on geographies consisting of 40,663,496 people shows a substantial negative correlation between the proportion of Yuman and percentage of married-couple family households in the United States with a correlation coefficient (R) of -0.526 and weighted average of 43.3%. Similarly, the statistical analysis conducted on geographies consisting of 285,610,844 people shows a poor negative correlation between the proportion of Nicaraguans and percentage of married-couple family households in the United States with a correlation coefficient (R) of -0.173 and weighted average of 45.2%, a difference of 4.4%.
Married-couple Households Correlation Summary
| Measurement | Yuman | Nicaraguan |
| Minimum | 4.1% | 23.2% |
| Maximum | 60.2% | 80.0% |
| Range | 56.2% | 56.8% |
| Mean | 41.8% | 46.2% |
| Median | 42.7% | 46.3% |
| Interquartile 25% (IQ1) | 30.0% | 40.8% |
| Interquartile 75% (IQ3) | 53.1% | 50.2% |
| Interquartile Range (IQR) | 23.0% | 9.4% |
| Standard Deviation (Sample) | 13.4% | 11.4% |
| Standard Deviation (Population) | 13.1% | 11.3% |
Similar Demographics by Married-couple Households
Demographics Similar to Yuman by Married-couple Households
In terms of married-couple households, the demographic groups most similar to Yuman are Immigrants from Sierra Leone (43.3%, a difference of 0.050%), Guatemalan (43.3%, a difference of 0.11%), Immigrants from Nigeria (43.2%, a difference of 0.21%), Immigrants from Burma/Myanmar (43.4%, a difference of 0.25%), and Ethiopian (43.2%, a difference of 0.31%).
| Demographics | Rating | Rank | Married-couple Households |
| Cree | 0.1 /100 | #263 | Tragic 43.6% |
| Bangladeshis | 0.1 /100 | #264 | Tragic 43.5% |
| Moroccans | 0.1 /100 | #265 | Tragic 43.5% |
| Ecuadorians | 0.1 /100 | #266 | Tragic 43.5% |
| Natives/Alaskans | 0.1 /100 | #267 | Tragic 43.5% |
| Immigrants | Burma/Myanmar | 0.1 /100 | #268 | Tragic 43.4% |
| Immigrants | Sierra Leone | 0.1 /100 | #269 | Tragic 43.3% |
| Yuman | 0.1 /100 | #270 | Tragic 43.3% |
| Guatemalans | 0.1 /100 | #271 | Tragic 43.3% |
| Immigrants | Nigeria | 0.1 /100 | #272 | Tragic 43.2% |
| Ethiopians | 0.1 /100 | #273 | Tragic 43.2% |
| Nigerians | 0.1 /100 | #274 | Tragic 43.2% |
| Immigrants | Bangladesh | 0.0 /100 | #275 | Tragic 43.1% |
| Immigrants | Ethiopia | 0.0 /100 | #276 | Tragic 43.1% |
| Immigrants | Eastern Africa | 0.0 /100 | #277 | Tragic 42.9% |
Demographics Similar to Nicaraguans by Married-couple Households
In terms of married-couple households, the demographic groups most similar to Nicaraguans are Immigrants from the Azores (45.2%, a difference of 0.010%), Panamanian (45.2%, a difference of 0.030%), Immigrants from Thailand (45.2%, a difference of 0.030%), Immigrants from Portugal (45.2%, a difference of 0.050%), and Immigrants from Nepal (45.2%, a difference of 0.060%).
| Demographics | Rating | Rank | Married-couple Households |
| Creek | 6.4 /100 | #212 | Tragic 45.3% |
| Yakama | 5.8 /100 | #213 | Tragic 45.2% |
| Japanese | 5.7 /100 | #214 | Tragic 45.2% |
| Immigrants | Nepal | 5.6 /100 | #215 | Tragic 45.2% |
| Immigrants | Portugal | 5.6 /100 | #216 | Tragic 45.2% |
| Panamanians | 5.5 /100 | #217 | Tragic 45.2% |
| Immigrants | Azores | 5.3 /100 | #218 | Tragic 45.2% |
| Nicaraguans | 5.3 /100 | #219 | Tragic 45.2% |
| Immigrants | Thailand | 5.1 /100 | #220 | Tragic 45.2% |
| Tlingit-Haida | 4.9 /100 | #221 | Tragic 45.1% |
| Immigrants | Laos | 4.6 /100 | #222 | Tragic 45.1% |
| Immigrants | Cambodia | 2.7 /100 | #223 | Tragic 44.9% |
| Immigrants | Micronesia | 2.6 /100 | #224 | Tragic 44.9% |
| Dutch West Indians | 2.6 /100 | #225 | Tragic 44.9% |
| Alsatians | 2.3 /100 | #226 | Tragic 44.8% |