Yuman vs Immigrants from Belgium Married-couple Households
COMPARE
Yuman
Immigrants from Belgium
Married-couple Households
Married-couple Households Comparison
Yuman
Immigrants from Belgium
43.3%
MARRIED-COUPLE HOUSEHOLDS
0.1/ 100
METRIC RATING
270th/ 347
METRIC RANK
47.9%
MARRIED-COUPLE HOUSEHOLDS
96.8/ 100
METRIC RATING
95th/ 347
METRIC RANK
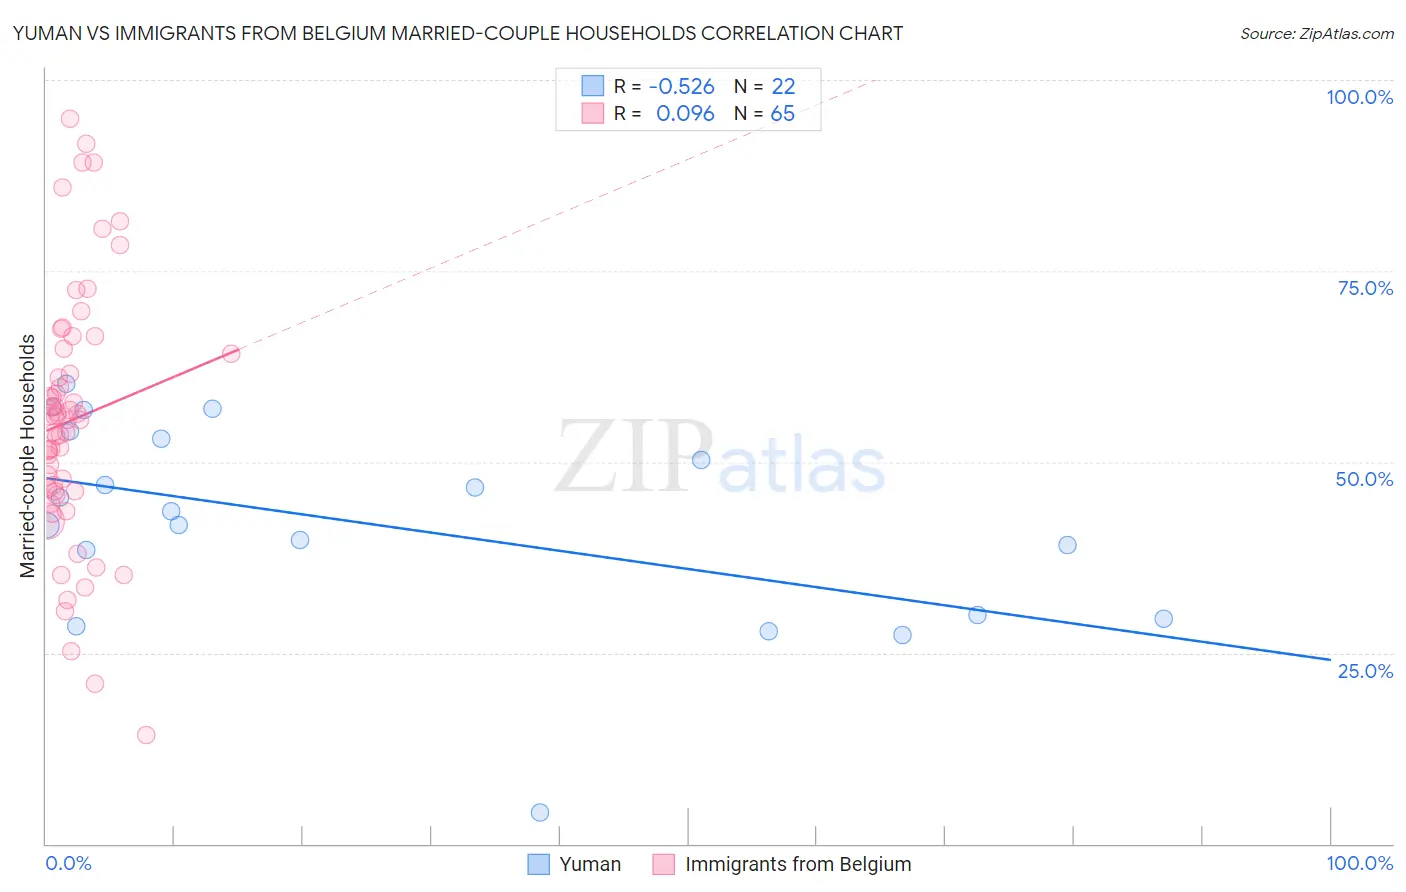
Yuman vs Immigrants from Belgium Married-couple Households Correlation Chart
The statistical analysis conducted on geographies consisting of 40,663,496 people shows a substantial negative correlation between the proportion of Yuman and percentage of married-couple family households in the United States with a correlation coefficient (R) of -0.526 and weighted average of 43.3%. Similarly, the statistical analysis conducted on geographies consisting of 146,698,570 people shows a slight positive correlation between the proportion of Immigrants from Belgium and percentage of married-couple family households in the United States with a correlation coefficient (R) of 0.096 and weighted average of 47.9%, a difference of 10.7%.
Married-couple Households Correlation Summary
| Measurement | Yuman | Immigrants from Belgium |
| Minimum | 4.1% | 14.3% |
| Maximum | 60.2% | 94.9% |
| Range | 56.2% | 80.6% |
| Mean | 41.8% | 55.5% |
| Median | 42.7% | 55.5% |
| Interquartile 25% (IQ1) | 30.0% | 46.1% |
| Interquartile 75% (IQ3) | 53.1% | 64.5% |
| Interquartile Range (IQR) | 23.0% | 18.4% |
| Standard Deviation (Sample) | 13.4% | 16.6% |
| Standard Deviation (Population) | 13.1% | 16.5% |
Similar Demographics by Married-couple Households
Demographics Similar to Yuman by Married-couple Households
In terms of married-couple households, the demographic groups most similar to Yuman are Immigrants from Sierra Leone (43.3%, a difference of 0.050%), Guatemalan (43.3%, a difference of 0.11%), Immigrants from Nigeria (43.2%, a difference of 0.21%), Immigrants from Burma/Myanmar (43.4%, a difference of 0.25%), and Ethiopian (43.2%, a difference of 0.31%).
| Demographics | Rating | Rank | Married-couple Households |
| Cree | 0.1 /100 | #263 | Tragic 43.6% |
| Bangladeshis | 0.1 /100 | #264 | Tragic 43.5% |
| Moroccans | 0.1 /100 | #265 | Tragic 43.5% |
| Ecuadorians | 0.1 /100 | #266 | Tragic 43.5% |
| Natives/Alaskans | 0.1 /100 | #267 | Tragic 43.5% |
| Immigrants | Burma/Myanmar | 0.1 /100 | #268 | Tragic 43.4% |
| Immigrants | Sierra Leone | 0.1 /100 | #269 | Tragic 43.3% |
| Yuman | 0.1 /100 | #270 | Tragic 43.3% |
| Guatemalans | 0.1 /100 | #271 | Tragic 43.3% |
| Immigrants | Nigeria | 0.1 /100 | #272 | Tragic 43.2% |
| Ethiopians | 0.1 /100 | #273 | Tragic 43.2% |
| Nigerians | 0.1 /100 | #274 | Tragic 43.2% |
| Immigrants | Bangladesh | 0.0 /100 | #275 | Tragic 43.1% |
| Immigrants | Ethiopia | 0.0 /100 | #276 | Tragic 43.1% |
| Immigrants | Eastern Africa | 0.0 /100 | #277 | Tragic 42.9% |
Demographics Similar to Immigrants from Belgium by Married-couple Households
In terms of married-couple households, the demographic groups most similar to Immigrants from Belgium are American (47.9%, a difference of 0.030%), Lebanese (47.9%, a difference of 0.040%), Immigrants from Egypt (47.9%, a difference of 0.050%), Palestinian (48.0%, a difference of 0.060%), and Immigrants from Moldova (48.0%, a difference of 0.070%).
| Demographics | Rating | Rank | Married-couple Households |
| Afghans | 97.3 /100 | #88 | Exceptional 48.0% |
| Cypriots | 97.2 /100 | #89 | Exceptional 48.0% |
| French | 97.2 /100 | #90 | Exceptional 48.0% |
| Immigrants | Moldova | 97.0 /100 | #91 | Exceptional 48.0% |
| Palestinians | 96.9 /100 | #92 | Exceptional 48.0% |
| Lebanese | 96.9 /100 | #93 | Exceptional 47.9% |
| Americans | 96.9 /100 | #94 | Exceptional 47.9% |
| Immigrants | Belgium | 96.8 /100 | #95 | Exceptional 47.9% |
| Immigrants | Egypt | 96.6 /100 | #96 | Exceptional 47.9% |
| Latvians | 96.5 /100 | #97 | Exceptional 47.9% |
| Immigrants | North Macedonia | 96.4 /100 | #98 | Exceptional 47.9% |
| Immigrants | Austria | 96.4 /100 | #99 | Exceptional 47.9% |
| Immigrants | Italy | 96.3 /100 | #100 | Exceptional 47.9% |
| Turks | 96.1 /100 | #101 | Exceptional 47.8% |
| Slavs | 96.0 /100 | #102 | Exceptional 47.8% |