Danish vs Arab Births to Unmarried Women
COMPARE
Danish
Arab
Births to Unmarried Women
Births to Unmarried Women Comparison
Danes
Arabs
28.7%
BIRTHS TO UNMARRIED WOMEN
98.2/ 100
METRIC RATING
79th/ 347
METRIC RANK
29.2%
BIRTHS TO UNMARRIED WOMEN
96.5/ 100
METRIC RATING
92nd/ 347
METRIC RANK
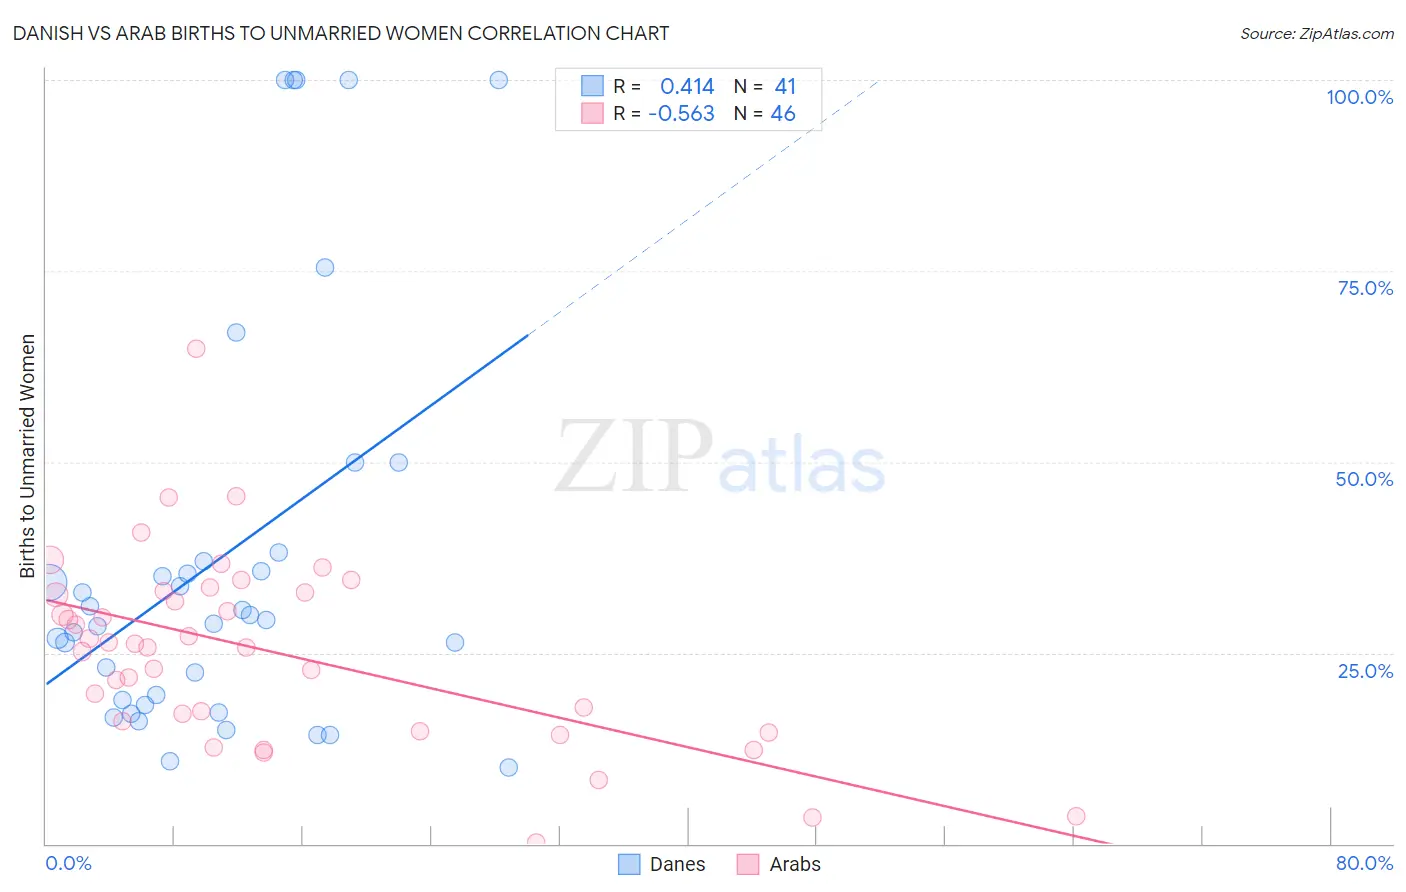
Danish vs Arab Births to Unmarried Women Correlation Chart
The statistical analysis conducted on geographies consisting of 430,380,429 people shows a moderate positive correlation between the proportion of Danes and percentage of births to unmarried women in the United States with a correlation coefficient (R) of 0.414 and weighted average of 28.7%. Similarly, the statistical analysis conducted on geographies consisting of 447,045,945 people shows a substantial negative correlation between the proportion of Arabs and percentage of births to unmarried women in the United States with a correlation coefficient (R) of -0.563 and weighted average of 29.2%, a difference of 1.7%.
Births to Unmarried Women Correlation Summary
| Measurement | Danish | Arab |
| Minimum | 10.0% | 0.20% |
| Maximum | 100.0% | 64.9% |
| Range | 90.0% | 64.7% |
| Mean | 37.6% | 25.1% |
| Median | 29.3% | 26.0% |
| Interquartile 25% (IQ1) | 18.5% | 16.0% |
| Interquartile 75% (IQ3) | 37.6% | 32.9% |
| Interquartile Range (IQR) | 19.0% | 16.9% |
| Standard Deviation (Sample) | 27.1% | 12.3% |
| Standard Deviation (Population) | 26.7% | 12.2% |
Demographics Similar to Danes and Arabs by Births to Unmarried Women
In terms of births to unmarried women, the demographic groups most similar to Danes are Zimbabwean (28.7%, a difference of 0.020%), Immigrants from Afghanistan (28.7%, a difference of 0.020%), Immigrants from Austria (28.7%, a difference of 0.070%), Romanian (28.7%, a difference of 0.18%), and Immigrants from Northern Europe (28.6%, a difference of 0.19%). Similarly, the demographic groups most similar to Arabs are Immigrants from Fiji (29.2%, a difference of 0.040%), Estonian (29.2%, a difference of 0.040%), Ukrainian (29.2%, a difference of 0.16%), Immigrants from Latvia (29.1%, a difference of 0.25%), and Immigrants from Vietnam (29.3%, a difference of 0.30%).
| Demographics | Rating | Rank | Births to Unmarried Women |
| Immigrants | Switzerland | 98.4 /100 | #75 | Exceptional 28.6% |
| Israelis | 98.4 /100 | #76 | Exceptional 28.6% |
| Immigrants | Northern Europe | 98.3 /100 | #77 | Exceptional 28.6% |
| Zimbabweans | 98.2 /100 | #78 | Exceptional 28.7% |
| Danes | 98.2 /100 | #79 | Exceptional 28.7% |
| Immigrants | Afghanistan | 98.1 /100 | #80 | Exceptional 28.7% |
| Immigrants | Austria | 98.1 /100 | #81 | Exceptional 28.7% |
| Romanians | 98.0 /100 | #82 | Exceptional 28.7% |
| Immigrants | Kuwait | 98.0 /100 | #83 | Exceptional 28.8% |
| Immigrants | Poland | 97.6 /100 | #84 | Exceptional 28.9% |
| Sri Lankans | 97.5 /100 | #85 | Exceptional 28.9% |
| Immigrants | Jordan | 97.4 /100 | #86 | Exceptional 29.0% |
| Taiwanese | 97.3 /100 | #87 | Exceptional 29.0% |
| Immigrants | France | 97.3 /100 | #88 | Exceptional 29.0% |
| Immigrants | Saudi Arabia | 97.0 /100 | #89 | Exceptional 29.1% |
| Immigrants | Latvia | 96.8 /100 | #90 | Exceptional 29.1% |
| Immigrants | Fiji | 96.6 /100 | #91 | Exceptional 29.2% |
| Arabs | 96.5 /100 | #92 | Exceptional 29.2% |
| Estonians | 96.5 /100 | #93 | Exceptional 29.2% |
| Ukrainians | 96.3 /100 | #94 | Exceptional 29.2% |
| Immigrants | Vietnam | 96.1 /100 | #95 | Exceptional 29.3% |