Yuman vs Arab Single Father Households

COMPARE

Yuman
Race
Ancestry
AfghanAfricanAlaska NativeAlaskan AthabascanAlbanianAleutAlsatianAmericanApacheArapahoArgentineanArmenianAssyrian/Chaldean/SyriacAustralianAustrianBahamianBangladeshiBarbadianBasqueBelgianBelizeanBermudanBhutaneseBlackfeetBolivianBrazilianBritishBritish West IndianBulgarianBurmeseCajunCambodianCanadianCape VerdeanCarpatho RusynCelticCentral AmericanCentral American IndianCherokeeCheyenneChickasawChileanChineseChippewaChoctawColombianColvilleComancheCosta RicanCreeCreekCroatianCrowCubanCypriotCzechCzechoslovakianDanishDelawareDominicanDutchDutch West IndianEastern EuropeanEcuadorianEgyptianEnglishEstonianEthiopianEuropeanFijianFilipinoFinnishFrenchFrench American IndianFrench CanadianGermanGerman RussianGhanaianGreekGuamanian/ChamorroGuatemalanGuyaneseHaitianHmongHonduranHopiHoumaHungarianIcelanderIndian (Asian)IndonesianInupiatIranianIraqiIrishIroquoisIsraeliItalianJamaicanJapaneseJordanianKenyanKiowaKoreanLaotianLatvianLebaneseLiberianLithuanianLumbeeLuxembourgerMacedonianMalaysianMalteseMarshalleseMenomineeMexicanMexican American IndianMongolianMoroccanNative HawaiianNavajoNepaleseNew ZealanderNicaraguanNigerianNorthern EuropeanNorwegianOkinawanOsageOttawaPaiutePakistaniPalestinianPanamanianParaguayanPennsylvania GermanPeruvianPimaPolishPortuguesePotawatomiPuebloPuerto RicanPuget Sound SalishRomanianRussianSalvadoranSamoanScandinavianScotch-IrishScottishSeminoleSenegaleseSerbianShoshoneSierra LeoneanSiouxSlavicSlovakSloveneSomaliSouth AfricanSouth AmericanSouth American IndianSoviet UnionSpaniardSpanishSpanish AmericanSpanish American IndianSri LankanSubsaharan AfricanSudaneseSwedishSwissSyrianTaiwaneseThaiTlingit-HaidaTohono O'OdhamTonganTrinidadian and TobagonianTsimshianTurkishU.S. Virgin IslanderUgandanUkrainianUruguayanUteVenezuelanVietnameseWelshWest IndianYakamaYaquiYugoslavianYumanYup'ikZimbabwean
Immigration
NonimmigrantsImmigrantsAfghanistanAfricaAlbaniaArgentinaArmeniaAsiaAustraliaAustriaBahamasBangladeshBarbadosBelarusBelgiumBelizeBoliviaBosnia and HerzegovinaBrazilBulgariaBurma/MyanmarCabo VerdeCambodiaCameroonCanadaCaribbeanCentral AmericaChileChinaColombiaCongoCosta RicaCroatiaCubaCzechoslovakiaDenmarkDominicaDominican RepublicEastern AfricaEastern AsiaEastern EuropeEcuadorEgyptEl SalvadorEnglandEritreaEthiopiaEuropeFijiFranceGermanyGhanaGreeceGrenadaGuatemalaGuyanaHaitiHondurasHong KongHungaryIndiaIndonesiaIranIraqIrelandIsraelItalyJamaicaJapanJordanKazakhstanKenyaKoreaKuwaitLaosLatin AmericaLatviaLebanonLiberiaLithuaniaMalaysiaMexicoMicronesiaMiddle AfricaMoldovaMoroccoNepalNetherlandsNicaraguaNigeriaNorth AmericaNorth MacedoniaNorthern AfricaNorthern EuropeNorwayOceaniaPakistanPanamaPeruPhilippinesPolandPortugalRomaniaRussiaSaudi ArabiaScotlandSenegalSerbiaSierra LeoneSingaporeSomaliaSouth AfricaSouth AmericaSouth Central AsiaSouth Eastern AsiaSouthern EuropeSpainSri LankaSt. Vincent and the GrenadinesSudanSwedenSwitzerlandSyriaTaiwanThailandTrinidad and TobagoTurkeyUgandaUkraineUruguayUzbekistanVenezuelaVietnamWest IndiesWestern AfricaWestern AsiaWestern EuropeYemenZaireZimbabweAzores
Arab
Race
Ancestry
AfghanAfricanAlaska NativeAlaskan AthabascanAlbanianAleutAlsatianAmericanApacheArabArapahoArgentineanArmenianAssyrian/Chaldean/SyriacAustralianAustrianBahamianBangladeshiBarbadianBasqueBelgianBelizeanBermudanBhutaneseBlackfeetBolivianBrazilianBritishBritish West IndianBulgarianBurmeseCajunCambodianCanadianCape VerdeanCarpatho RusynCelticCentral AmericanCentral American IndianCherokeeCheyenneChickasawChileanChineseChippewaChoctawColombianColvilleComancheCosta RicanCreeCreekCroatianCrowCubanCypriotCzechCzechoslovakianDanishDelawareDominicanDutchDutch West IndianEastern EuropeanEcuadorianEgyptianEnglishEstonianEthiopianEuropeanFijianFilipinoFinnishFrenchFrench American IndianFrench CanadianGermanGerman RussianGhanaianGreekGuamanian/ChamorroGuatemalanGuyaneseHaitianHmongHonduranHopiHoumaHungarianIcelanderIndian (Asian)IndonesianInupiatIranianIraqiIrishIroquoisIsraeliItalianJamaicanJapaneseJordanianKenyanKiowaKoreanLaotianLatvianLebaneseLiberianLithuanianLumbeeLuxembourgerMacedonianMalaysianMalteseMarshalleseMenomineeMexicanMexican American IndianMongolianMoroccanNative HawaiianNavajoNepaleseNew ZealanderNicaraguanNigerianNorthern EuropeanNorwegianOkinawanOsageOttawaPaiutePakistaniPalestinianPanamanianParaguayanPennsylvania GermanPeruvianPimaPolishPortuguesePotawatomiPuebloPuerto RicanPuget Sound SalishRomanianRussianSalvadoranSamoanScandinavianScotch-IrishScottishSeminoleSenegaleseSerbianShoshoneSierra LeoneanSiouxSlavicSlovakSloveneSomaliSouth AfricanSouth AmericanSouth American IndianSoviet UnionSpaniardSpanishSpanish AmericanSpanish American IndianSri LankanSubsaharan AfricanSudaneseSwedishSwissSyrianTaiwaneseThaiTlingit-HaidaTohono O'OdhamTonganTrinidadian and TobagonianTsimshianTurkishU.S. Virgin IslanderUgandanUkrainianUruguayanUteVenezuelanVietnameseWelshWest IndianYakamaYaquiYugoslavianYup'ikZimbabwean
Immigration
NonimmigrantsImmigrantsAfghanistanAfricaAlbaniaArgentinaArmeniaAsiaAustraliaAustriaBahamasBangladeshBarbadosBelarusBelgiumBelizeBoliviaBosnia and HerzegovinaBrazilBulgariaBurma/MyanmarCabo VerdeCambodiaCameroonCanadaCaribbeanCentral AmericaChileChinaColombiaCongoCosta RicaCroatiaCubaCzechoslovakiaDenmarkDominicaDominican RepublicEastern AfricaEastern AsiaEastern EuropeEcuadorEgyptEl SalvadorEnglandEritreaEthiopiaEuropeFijiFranceGermanyGhanaGreeceGrenadaGuatemalaGuyanaHaitiHondurasHong KongHungaryIndiaIndonesiaIranIraqIrelandIsraelItalyJamaicaJapanJordanKazakhstanKenyaKoreaKuwaitLaosLatin AmericaLatviaLebanonLiberiaLithuaniaMalaysiaMexicoMicronesiaMiddle AfricaMoldovaMoroccoNepalNetherlandsNicaraguaNigeriaNorth AmericaNorth MacedoniaNorthern AfricaNorthern EuropeNorwayOceaniaPakistanPanamaPeruPhilippinesPolandPortugalRomaniaRussiaSaudi ArabiaScotlandSenegalSerbiaSierra LeoneSingaporeSomaliaSouth AfricaSouth AmericaSouth Central AsiaSouth Eastern AsiaSouthern EuropeSpainSri LankaSt. Vincent and the GrenadinesSudanSwedenSwitzerlandSyriaTaiwanThailandTrinidad and TobagoTurkeyUgandaUkraineUruguayUzbekistanVenezuelaVietnamWest IndiesWestern AfricaWestern AsiaWestern EuropeYemenZaireZimbabweAzores
Single Father Households
Income
Poverty
Unemployment
Labor Participation
Family Structure
Vehicle Availability
Education Level
Disability

Single Father Households Comparison

Yuman

Arabs

Tragic
Exceptional
3.3%
SINGLE FATHER HOUSEHOLDS
0.0/ 100
METRIC RATING
334th/ 347
METRIC RANK
2.1%
SINGLE FATHER HOUSEHOLDS
99.2/ 100
METRIC RATING
96th/ 347
METRIC RANK

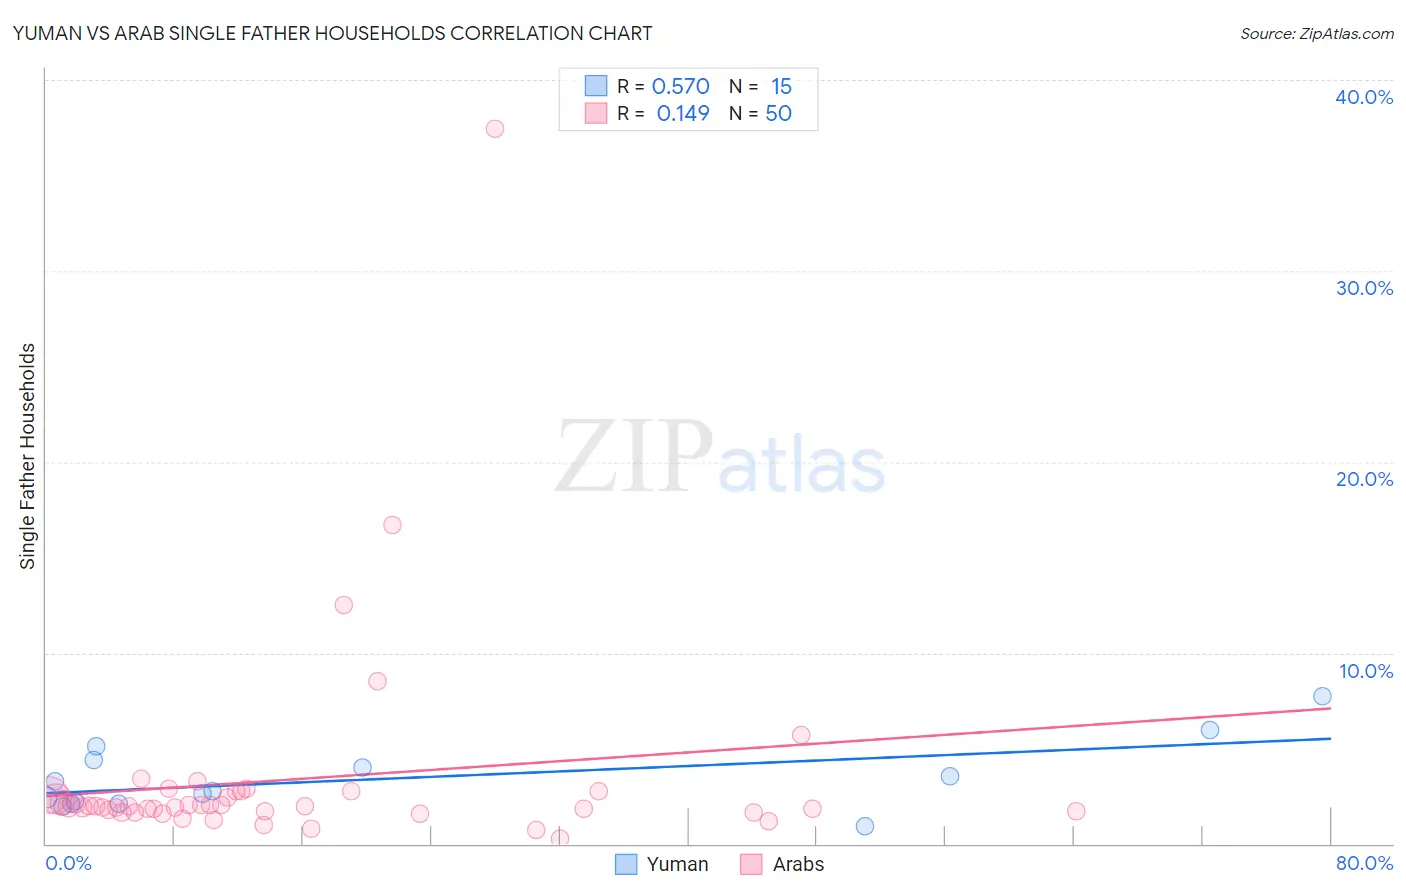
Yuman vs Arab Single Father Households Correlation Chart

The statistical analysis conducted on geographies consisting of 40,610,556 people shows a substantial positive correlation between the proportion of Yuman and percentage of single father households in the United States with a correlation coefficient (R) of 0.570 and weighted average of 3.3%. Similarly, the statistical analysis conducted on geographies consisting of 480,579,440 people shows a poor positive correlation between the proportion of Arabs and percentage of single father households in the United States with a correlation coefficient (R) of 0.149 and weighted average of 2.1%, a difference of 54.6%.
Yuman vs Arab Single Father Households

Single Father Households Correlation Summary

MeasurementYumanArab
Minimum0.94%0.25%
Maximum7.7%37.5%
Range6.8%37.2%
Mean3.4%3.4%
Median2.7%2.0%
Interquartile 25% (IQ1)2.1%1.7%
Interquartile 75% (IQ3)4.4%2.7%
Interquartile Range (IQR)2.3%1.0%
Standard Deviation (Sample)1.8%5.6%
Standard Deviation (Population)1.7%5.6%

Similar Demographics by Single Father Households

Demographics Similar to Yuman by Single Father Households

In terms of single father households, the demographic groups most similar to Yuman are Colville (3.3%, a difference of 0.020%), Paiute (3.3%, a difference of 0.050%), Pueblo (3.3%, a difference of 0.30%), Sioux (3.3%, a difference of 0.98%), and Alaskan Athabascan (3.4%, a difference of 2.5%).
DemographicsRating | RankSingle Father Households
Bangladeshis
0.0
/100
|
#327
Tragic
3.1%
Immigrants | Cabo Verde
0.0
/100
|
#328
Tragic
3.1%
Chippewa
0.0
/100
|
#329
Tragic
3.1%
Nepalese
0.0
/100
|
#330
Tragic
3.1%
Navajo
0.0
/100
|
#331
Tragic
3.2%
Yaqui
0.0
/100
|
#332
Tragic
3.2%
Natives/Alaskans
0.0
/100
|
#333
Tragic
3.2%
Yuman
0.0
/100
|
#334
Tragic
3.3%
Colville
0.0
/100
|
#335
Tragic
3.3%
Paiute
0.0
/100
|
#336
Tragic
3.3%
Pueblo
0.0
/100
|
#337
Tragic
3.3%
Sioux
0.0
/100
|
#338
Tragic
3.3%
Alaskan Athabascans
0.0
/100
|
#339
Tragic
3.4%
Alaska Natives
0.0
/100
|
#340
Tragic
3.5%
Crow
0.0
/100
|
#341
Tragic
3.5%

Demographics Similar to Arabs by Single Father Households

In terms of single father households, the demographic groups most similar to Arabs are Immigrants from Moldova (2.1%, a difference of 0.13%), Bermudan (2.1%, a difference of 0.14%), Guyanese (2.1%, a difference of 0.25%), South African (2.1%, a difference of 0.30%), and Croatian (2.1%, a difference of 0.37%).
DemographicsRating | RankSingle Father Households
Immigrants | Armenia
99.5
/100
|
#89
Exceptional
2.1%
Immigrants | Pakistan
99.5
/100
|
#90
Exceptional
2.1%
Immigrants | Guyana
99.4
/100
|
#91
Exceptional
2.1%
Romanians
99.4
/100
|
#92
Exceptional
2.1%
Croatians
99.3
/100
|
#93
Exceptional
2.1%
Ukrainians
99.3
/100
|
#94
Exceptional
2.1%
Bermudans
99.2
/100
|
#95
Exceptional
2.1%
Arabs
99.2
/100
|
#96
Exceptional
2.1%
Immigrants | Moldova
99.1
/100
|
#97
Exceptional
2.1%
Guyanese
99.1
/100
|
#98
Exceptional
2.1%
South Africans
99.1
/100
|
#99
Exceptional
2.1%
Immigrants | Northern Africa
99.0
/100
|
#100
Exceptional
2.1%
Immigrants | Western Europe
98.9
/100
|
#101
Exceptional
2.1%
Argentineans
98.9
/100
|
#102
Exceptional
2.1%
Lebanese
98.9
/100
|
#103
Exceptional
2.1%