Yugoslavian vs Lithuanian Divorced or Separated
COMPARE
Yugoslavian
Lithuanian
Divorced or Separated
Divorced or Separated Comparison
Yugoslavians
Lithuanians
12.3%
DIVORCED OR SEPARATED
6.6/ 100
METRIC RATING
231st/ 347
METRIC RANK
11.7%
DIVORCED OR SEPARATED
95.7/ 100
METRIC RATING
115th/ 347
METRIC RANK
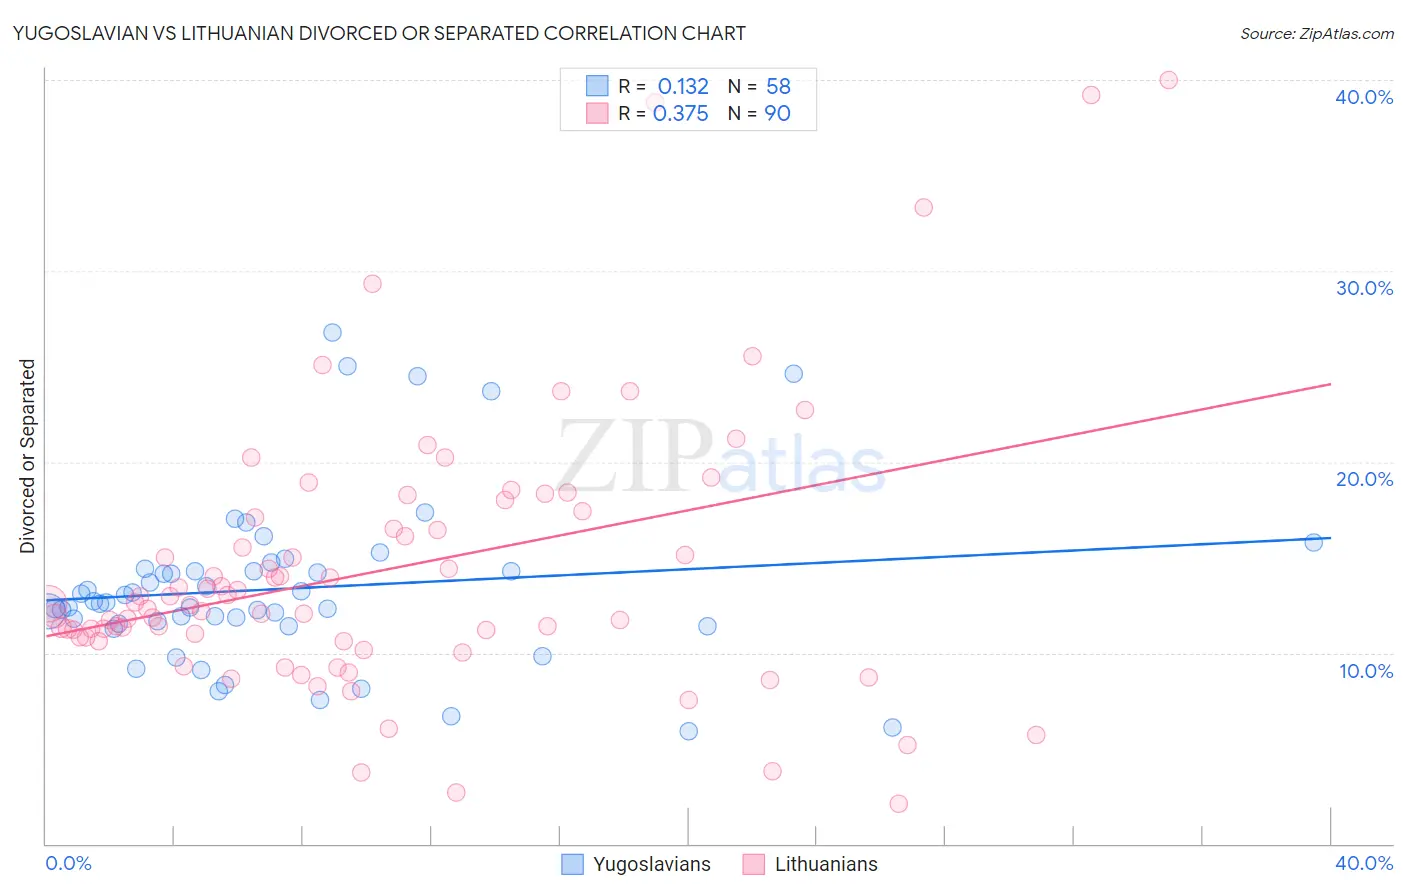
Yugoslavian vs Lithuanian Divorced or Separated Correlation Chart
The statistical analysis conducted on geographies consisting of 285,666,571 people shows a poor positive correlation between the proportion of Yugoslavians and percentage of population currently divorced or separated in the United States with a correlation coefficient (R) of 0.132 and weighted average of 12.3%. Similarly, the statistical analysis conducted on geographies consisting of 421,781,235 people shows a mild positive correlation between the proportion of Lithuanians and percentage of population currently divorced or separated in the United States with a correlation coefficient (R) of 0.375 and weighted average of 11.7%, a difference of 5.1%.
Divorced or Separated Correlation Summary
| Measurement | Yugoslavian | Lithuanian |
| Minimum | 5.9% | 2.1% |
| Maximum | 26.8% | 40.0% |
| Range | 20.9% | 37.9% |
| Mean | 13.4% | 14.4% |
| Median | 12.6% | 12.5% |
| Interquartile 25% (IQ1) | 11.5% | 10.8% |
| Interquartile 75% (IQ3) | 14.3% | 17.1% |
| Interquartile Range (IQR) | 2.8% | 6.3% |
| Standard Deviation (Sample) | 4.4% | 7.2% |
| Standard Deviation (Population) | 4.4% | 7.2% |
Similar Demographics by Divorced or Separated
Demographics Similar to Yugoslavians by Divorced or Separated
In terms of divorced or separated, the demographic groups most similar to Yugoslavians are Yakama (12.3%, a difference of 0.15%), Canadian (12.4%, a difference of 0.19%), Immigrants from Sudan (12.3%, a difference of 0.20%), Immigrants from Cameroon (12.3%, a difference of 0.22%), and Hmong (12.3%, a difference of 0.27%).
| Demographics | Rating | Rank | Divorced or Separated |
| Immigrants | Azores | 9.7 /100 | #224 | Tragic 12.3% |
| Belgians | 9.7 /100 | #225 | Tragic 12.3% |
| Immigrants | Western Africa | 9.3 /100 | #226 | Tragic 12.3% |
| Hmong | 8.8 /100 | #227 | Tragic 12.3% |
| Immigrants | Cameroon | 8.3 /100 | #228 | Tragic 12.3% |
| Immigrants | Sudan | 8.2 /100 | #229 | Tragic 12.3% |
| Yakama | 7.8 /100 | #230 | Tragic 12.3% |
| Yugoslavians | 6.6 /100 | #231 | Tragic 12.3% |
| Canadians | 5.3 /100 | #232 | Tragic 12.4% |
| Malaysians | 4.8 /100 | #233 | Tragic 12.4% |
| West Indians | 4.4 /100 | #234 | Tragic 12.4% |
| Immigrants | Bosnia and Herzegovina | 4.3 /100 | #235 | Tragic 12.4% |
| Colombians | 4.2 /100 | #236 | Tragic 12.4% |
| Immigrants | Laos | 4.2 /100 | #237 | Tragic 12.4% |
| Sudanese | 4.0 /100 | #238 | Tragic 12.4% |
Demographics Similar to Lithuanians by Divorced or Separated
In terms of divorced or separated, the demographic groups most similar to Lithuanians are Immigrants from Norway (11.7%, a difference of 0.050%), Immigrants from Iraq (11.7%, a difference of 0.060%), Immigrants from Uganda (11.7%, a difference of 0.080%), Ecuadorian (11.7%, a difference of 0.090%), and Syrian (11.7%, a difference of 0.13%).
| Demographics | Rating | Rank | Divorced or Separated |
| Greeks | 96.9 /100 | #108 | Exceptional 11.7% |
| Immigrants | South Africa | 96.9 /100 | #109 | Exceptional 11.7% |
| Immigrants | Czechoslovakia | 96.9 /100 | #110 | Exceptional 11.7% |
| Immigrants | Spain | 96.8 /100 | #111 | Exceptional 11.7% |
| Immigrants | France | 96.6 /100 | #112 | Exceptional 11.7% |
| Estonians | 96.6 /100 | #113 | Exceptional 11.7% |
| Immigrants | Norway | 95.9 /100 | #114 | Exceptional 11.7% |
| Lithuanians | 95.7 /100 | #115 | Exceptional 11.7% |
| Immigrants | Iraq | 95.4 /100 | #116 | Exceptional 11.7% |
| Immigrants | Uganda | 95.3 /100 | #117 | Exceptional 11.7% |
| Ecuadorians | 95.3 /100 | #118 | Exceptional 11.7% |
| Syrians | 95.1 /100 | #119 | Exceptional 11.7% |
| Iraqis | 94.6 /100 | #120 | Exceptional 11.8% |
| Romanians | 94.5 /100 | #121 | Exceptional 11.8% |
| Menominee | 93.8 /100 | #122 | Exceptional 11.8% |