Yugoslavian vs Immigrants from Burma/Myanmar Divorced or Separated
COMPARE
Yugoslavian
Immigrants from Burma/Myanmar
Divorced or Separated
Divorced or Separated Comparison
Yugoslavians
Immigrants from Burma/Myanmar
12.3%
DIVORCED OR SEPARATED
6.6/ 100
METRIC RATING
231st/ 347
METRIC RANK
12.1%
DIVORCED OR SEPARATED
30.4/ 100
METRIC RATING
196th/ 347
METRIC RANK
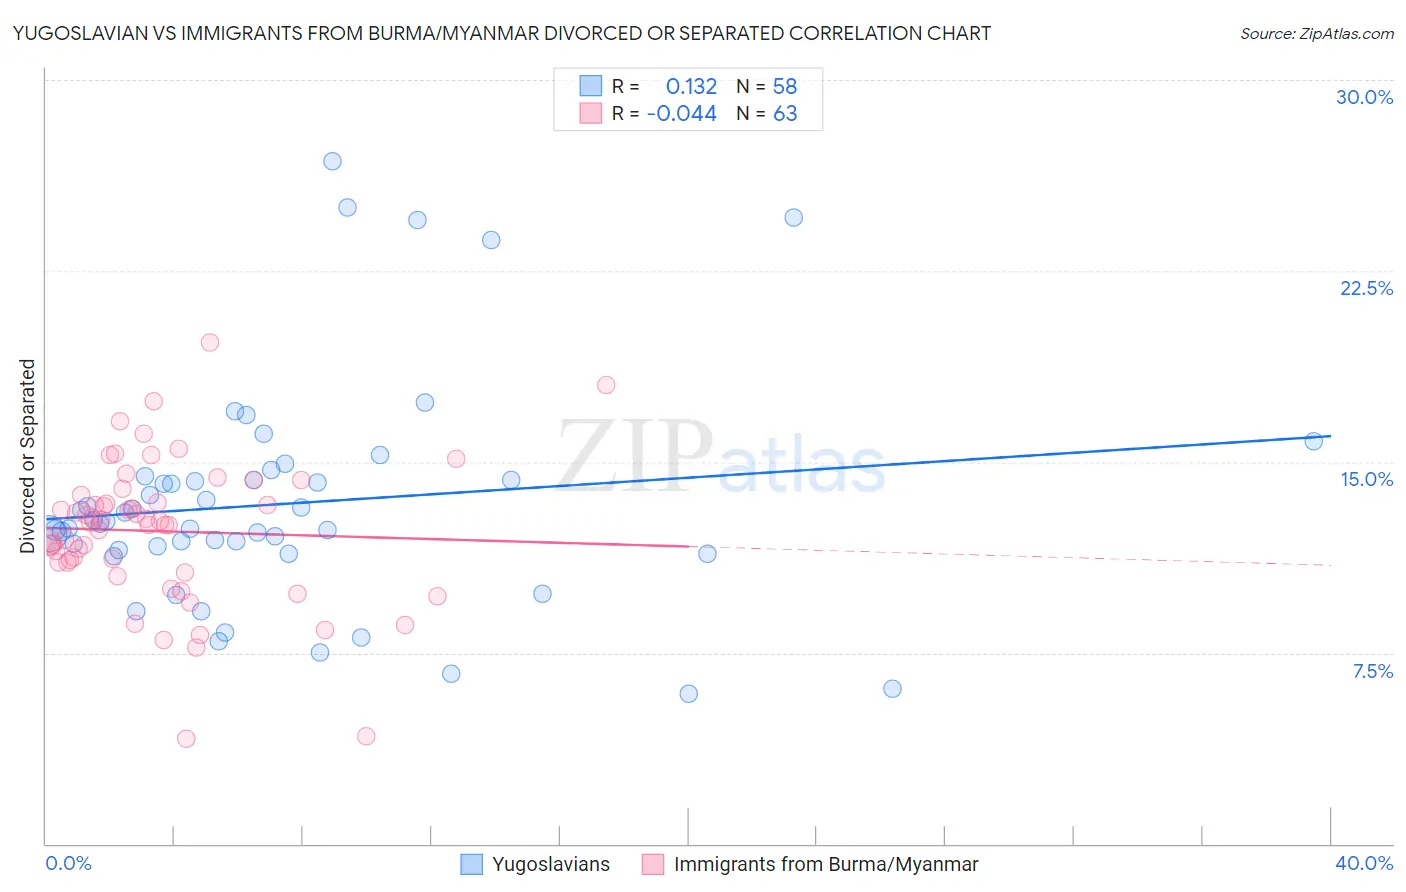
Yugoslavian vs Immigrants from Burma/Myanmar Divorced or Separated Correlation Chart
The statistical analysis conducted on geographies consisting of 285,666,571 people shows a poor positive correlation between the proportion of Yugoslavians and percentage of population currently divorced or separated in the United States with a correlation coefficient (R) of 0.132 and weighted average of 12.3%. Similarly, the statistical analysis conducted on geographies consisting of 172,295,998 people shows no correlation between the proportion of Immigrants from Burma/Myanmar and percentage of population currently divorced or separated in the United States with a correlation coefficient (R) of -0.044 and weighted average of 12.1%, a difference of 1.6%.
Divorced or Separated Correlation Summary
| Measurement | Yugoslavian | Immigrants from Burma/Myanmar |
| Minimum | 5.9% | 4.1% |
| Maximum | 26.8% | 19.7% |
| Range | 20.9% | 15.6% |
| Mean | 13.4% | 12.3% |
| Median | 12.6% | 12.6% |
| Interquartile 25% (IQ1) | 11.5% | 11.0% |
| Interquartile 75% (IQ3) | 14.3% | 13.7% |
| Interquartile Range (IQR) | 2.8% | 2.7% |
| Standard Deviation (Sample) | 4.4% | 2.8% |
| Standard Deviation (Population) | 4.4% | 2.8% |
Similar Demographics by Divorced or Separated
Demographics Similar to Yugoslavians by Divorced or Separated
In terms of divorced or separated, the demographic groups most similar to Yugoslavians are Yakama (12.3%, a difference of 0.15%), Canadian (12.4%, a difference of 0.19%), Immigrants from Sudan (12.3%, a difference of 0.20%), Immigrants from Cameroon (12.3%, a difference of 0.22%), and Hmong (12.3%, a difference of 0.27%).
| Demographics | Rating | Rank | Divorced or Separated |
| Immigrants | Azores | 9.7 /100 | #224 | Tragic 12.3% |
| Belgians | 9.7 /100 | #225 | Tragic 12.3% |
| Immigrants | Western Africa | 9.3 /100 | #226 | Tragic 12.3% |
| Hmong | 8.8 /100 | #227 | Tragic 12.3% |
| Immigrants | Cameroon | 8.3 /100 | #228 | Tragic 12.3% |
| Immigrants | Sudan | 8.2 /100 | #229 | Tragic 12.3% |
| Yakama | 7.8 /100 | #230 | Tragic 12.3% |
| Yugoslavians | 6.6 /100 | #231 | Tragic 12.3% |
| Canadians | 5.3 /100 | #232 | Tragic 12.4% |
| Malaysians | 4.8 /100 | #233 | Tragic 12.4% |
| West Indians | 4.4 /100 | #234 | Tragic 12.4% |
| Immigrants | Bosnia and Herzegovina | 4.3 /100 | #235 | Tragic 12.4% |
| Colombians | 4.2 /100 | #236 | Tragic 12.4% |
| Immigrants | Laos | 4.2 /100 | #237 | Tragic 12.4% |
| Sudanese | 4.0 /100 | #238 | Tragic 12.4% |
Demographics Similar to Immigrants from Burma/Myanmar by Divorced or Separated
In terms of divorced or separated, the demographic groups most similar to Immigrants from Burma/Myanmar are Immigrants from Africa (12.1%, a difference of 0.0%), Nigerian (12.1%, a difference of 0.010%), Immigrants from England (12.1%, a difference of 0.040%), Central American (12.1%, a difference of 0.040%), and Immigrants from Eritrea (12.1%, a difference of 0.060%).
| Demographics | Rating | Rank | Divorced or Separated |
| Sierra Leoneans | 35.5 /100 | #189 | Fair 12.1% |
| Moroccans | 34.8 /100 | #190 | Fair 12.1% |
| Swedes | 34.4 /100 | #191 | Fair 12.1% |
| Norwegians | 33.2 /100 | #192 | Fair 12.1% |
| Immigrants | Thailand | 32.5 /100 | #193 | Fair 12.1% |
| Immigrants | Eritrea | 31.9 /100 | #194 | Fair 12.1% |
| Immigrants | England | 31.4 /100 | #195 | Fair 12.1% |
| Immigrants | Burma/Myanmar | 30.4 /100 | #196 | Fair 12.1% |
| Immigrants | Africa | 30.3 /100 | #197 | Fair 12.1% |
| Nigerians | 30.1 /100 | #198 | Fair 12.1% |
| Central Americans | 29.4 /100 | #199 | Fair 12.1% |
| South Americans | 28.6 /100 | #200 | Fair 12.2% |
| Guatemalans | 26.9 /100 | #201 | Fair 12.2% |
| Portuguese | 23.5 /100 | #202 | Fair 12.2% |
| Immigrants | Guatemala | 23.2 /100 | #203 | Fair 12.2% |