Yugoslavian vs Colville Divorced or Separated
COMPARE
Yugoslavian
Colville
Divorced or Separated
Divorced or Separated Comparison
Yugoslavians
Colville
12.3%
DIVORCED OR SEPARATED
6.6/ 100
METRIC RATING
231st/ 347
METRIC RANK
14.2%
DIVORCED OR SEPARATED
0.0/ 100
METRIC RATING
339th/ 347
METRIC RANK
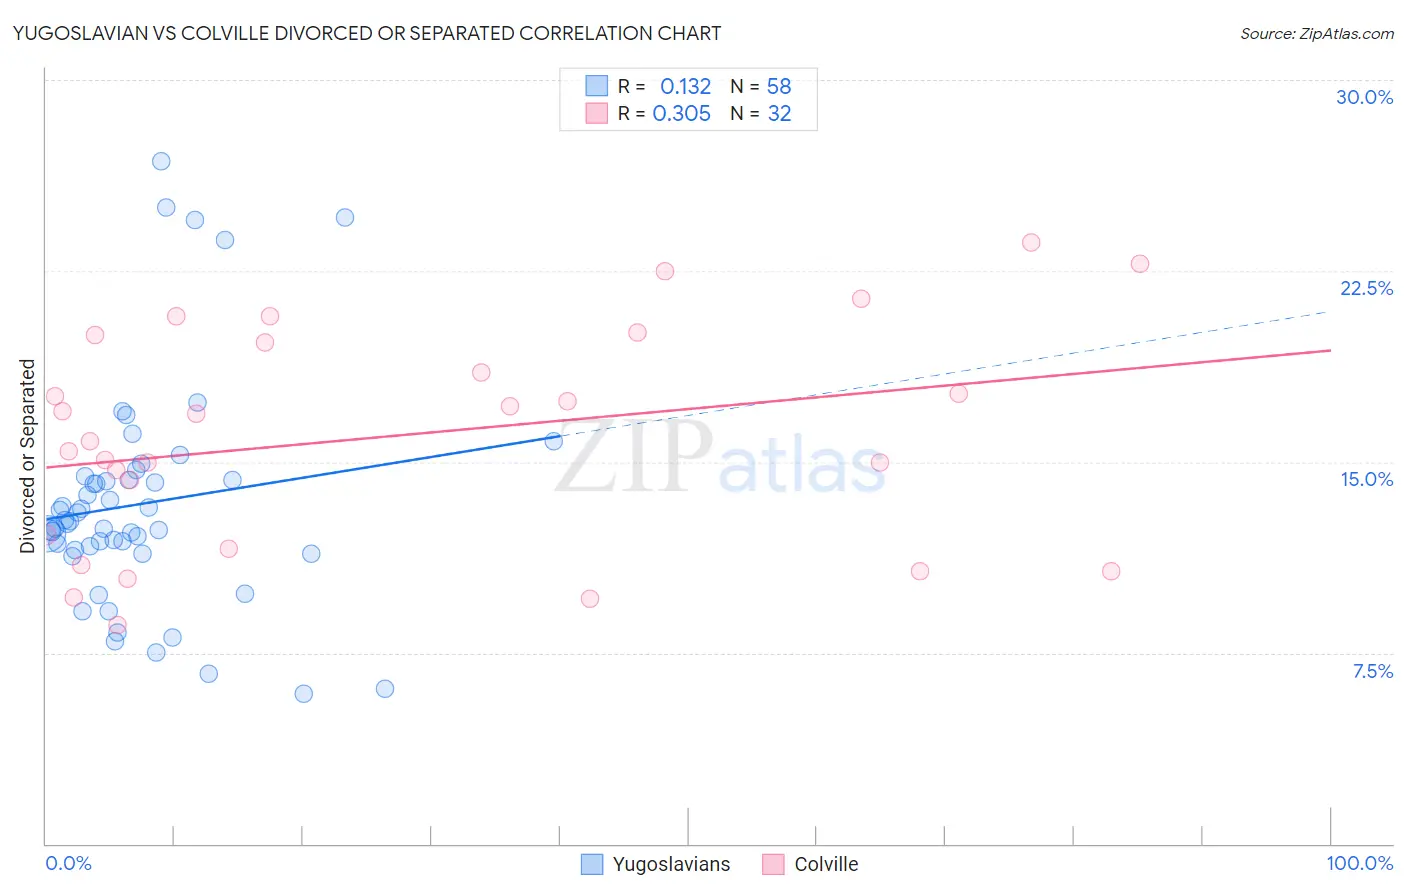
Yugoslavian vs Colville Divorced or Separated Correlation Chart
The statistical analysis conducted on geographies consisting of 285,666,571 people shows a poor positive correlation between the proportion of Yugoslavians and percentage of population currently divorced or separated in the United States with a correlation coefficient (R) of 0.132 and weighted average of 12.3%. Similarly, the statistical analysis conducted on geographies consisting of 34,683,925 people shows a mild positive correlation between the proportion of Colville and percentage of population currently divorced or separated in the United States with a correlation coefficient (R) of 0.305 and weighted average of 14.2%, a difference of 15.1%.
Divorced or Separated Correlation Summary
| Measurement | Yugoslavian | Colville |
| Minimum | 5.9% | 8.6% |
| Maximum | 26.8% | 23.6% |
| Range | 20.9% | 15.0% |
| Mean | 13.4% | 16.0% |
| Median | 12.6% | 16.4% |
| Interquartile 25% (IQ1) | 11.5% | 11.9% |
| Interquartile 75% (IQ3) | 14.3% | 19.8% |
| Interquartile Range (IQR) | 2.8% | 8.0% |
| Standard Deviation (Sample) | 4.4% | 4.3% |
| Standard Deviation (Population) | 4.4% | 4.2% |
Similar Demographics by Divorced or Separated
Demographics Similar to Yugoslavians by Divorced or Separated
In terms of divorced or separated, the demographic groups most similar to Yugoslavians are Yakama (12.3%, a difference of 0.15%), Canadian (12.4%, a difference of 0.19%), Immigrants from Sudan (12.3%, a difference of 0.20%), Immigrants from Cameroon (12.3%, a difference of 0.22%), and Hmong (12.3%, a difference of 0.27%).
| Demographics | Rating | Rank | Divorced or Separated |
| Immigrants | Azores | 9.7 /100 | #224 | Tragic 12.3% |
| Belgians | 9.7 /100 | #225 | Tragic 12.3% |
| Immigrants | Western Africa | 9.3 /100 | #226 | Tragic 12.3% |
| Hmong | 8.8 /100 | #227 | Tragic 12.3% |
| Immigrants | Cameroon | 8.3 /100 | #228 | Tragic 12.3% |
| Immigrants | Sudan | 8.2 /100 | #229 | Tragic 12.3% |
| Yakama | 7.8 /100 | #230 | Tragic 12.3% |
| Yugoslavians | 6.6 /100 | #231 | Tragic 12.3% |
| Canadians | 5.3 /100 | #232 | Tragic 12.4% |
| Malaysians | 4.8 /100 | #233 | Tragic 12.4% |
| West Indians | 4.4 /100 | #234 | Tragic 12.4% |
| Immigrants | Bosnia and Herzegovina | 4.3 /100 | #235 | Tragic 12.4% |
| Colombians | 4.2 /100 | #236 | Tragic 12.4% |
| Immigrants | Laos | 4.2 /100 | #237 | Tragic 12.4% |
| Sudanese | 4.0 /100 | #238 | Tragic 12.4% |
Demographics Similar to Colville by Divorced or Separated
In terms of divorced or separated, the demographic groups most similar to Colville are Chickasaw (14.2%, a difference of 0.040%), Bahamian (14.2%, a difference of 0.24%), Seminole (14.3%, a difference of 0.40%), Choctaw (14.1%, a difference of 0.53%), and Crow (14.1%, a difference of 0.84%).
| Demographics | Rating | Rank | Divorced or Separated |
| Cherokee | 0.0 /100 | #332 | Tragic 13.7% |
| Puerto Ricans | 0.0 /100 | #333 | Tragic 13.9% |
| Immigrants | Bahamas | 0.0 /100 | #334 | Tragic 13.9% |
| Dutch West Indians | 0.0 /100 | #335 | Tragic 14.0% |
| Shoshone | 0.0 /100 | #336 | Tragic 14.0% |
| Crow | 0.0 /100 | #337 | Tragic 14.1% |
| Choctaw | 0.0 /100 | #338 | Tragic 14.1% |
| Colville | 0.0 /100 | #339 | Tragic 14.2% |
| Chickasaw | 0.0 /100 | #340 | Tragic 14.2% |
| Bahamians | 0.0 /100 | #341 | Tragic 14.2% |
| Seminole | 0.0 /100 | #342 | Tragic 14.3% |
| Creek | 0.0 /100 | #343 | Tragic 14.4% |
| Cubans | 0.0 /100 | #344 | Tragic 14.5% |
| Kiowa | 0.0 /100 | #345 | Tragic 14.5% |
| Arapaho | 0.0 /100 | #346 | Tragic 14.8% |