Yugoslavian vs Potawatomi Divorced or Separated
COMPARE
Yugoslavian
Potawatomi
Divorced or Separated
Divorced or Separated Comparison
Yugoslavians
Potawatomi
12.3%
DIVORCED OR SEPARATED
6.6/ 100
METRIC RATING
231st/ 347
METRIC RANK
13.5%
DIVORCED OR SEPARATED
0.0/ 100
METRIC RATING
325th/ 347
METRIC RANK
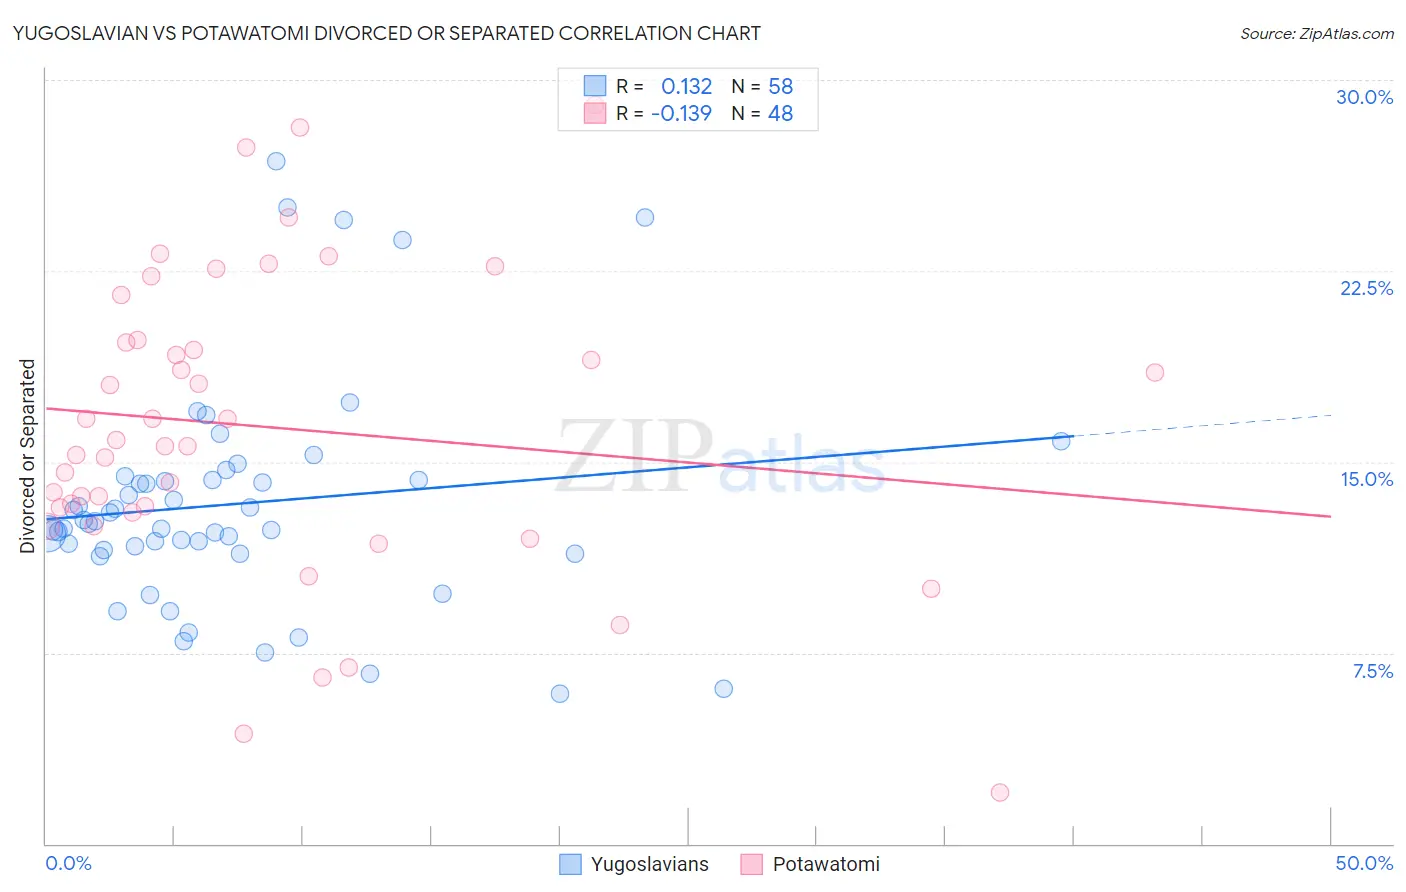
Yugoslavian vs Potawatomi Divorced or Separated Correlation Chart
The statistical analysis conducted on geographies consisting of 285,666,571 people shows a poor positive correlation between the proportion of Yugoslavians and percentage of population currently divorced or separated in the United States with a correlation coefficient (R) of 0.132 and weighted average of 12.3%. Similarly, the statistical analysis conducted on geographies consisting of 117,768,294 people shows a poor negative correlation between the proportion of Potawatomi and percentage of population currently divorced or separated in the United States with a correlation coefficient (R) of -0.139 and weighted average of 13.5%, a difference of 9.1%.
Divorced or Separated Correlation Summary
| Measurement | Yugoslavian | Potawatomi |
| Minimum | 5.9% | 2.0% |
| Maximum | 26.8% | 29.0% |
| Range | 20.9% | 27.0% |
| Mean | 13.4% | 16.4% |
| Median | 12.6% | 15.7% |
| Interquartile 25% (IQ1) | 11.5% | 13.1% |
| Interquartile 75% (IQ3) | 14.3% | 19.7% |
| Interquartile Range (IQR) | 2.8% | 6.6% |
| Standard Deviation (Sample) | 4.4% | 5.9% |
| Standard Deviation (Population) | 4.4% | 5.8% |
Similar Demographics by Divorced or Separated
Demographics Similar to Yugoslavians by Divorced or Separated
In terms of divorced or separated, the demographic groups most similar to Yugoslavians are Yakama (12.3%, a difference of 0.15%), Canadian (12.4%, a difference of 0.19%), Immigrants from Sudan (12.3%, a difference of 0.20%), Immigrants from Cameroon (12.3%, a difference of 0.22%), and Hmong (12.3%, a difference of 0.27%).
| Demographics | Rating | Rank | Divorced or Separated |
| Immigrants | Azores | 9.7 /100 | #224 | Tragic 12.3% |
| Belgians | 9.7 /100 | #225 | Tragic 12.3% |
| Immigrants | Western Africa | 9.3 /100 | #226 | Tragic 12.3% |
| Hmong | 8.8 /100 | #227 | Tragic 12.3% |
| Immigrants | Cameroon | 8.3 /100 | #228 | Tragic 12.3% |
| Immigrants | Sudan | 8.2 /100 | #229 | Tragic 12.3% |
| Yakama | 7.8 /100 | #230 | Tragic 12.3% |
| Yugoslavians | 6.6 /100 | #231 | Tragic 12.3% |
| Canadians | 5.3 /100 | #232 | Tragic 12.4% |
| Malaysians | 4.8 /100 | #233 | Tragic 12.4% |
| West Indians | 4.4 /100 | #234 | Tragic 12.4% |
| Immigrants | Bosnia and Herzegovina | 4.3 /100 | #235 | Tragic 12.4% |
| Colombians | 4.2 /100 | #236 | Tragic 12.4% |
| Immigrants | Laos | 4.2 /100 | #237 | Tragic 12.4% |
| Sudanese | 4.0 /100 | #238 | Tragic 12.4% |
Demographics Similar to Potawatomi by Divorced or Separated
In terms of divorced or separated, the demographic groups most similar to Potawatomi are Immigrants from Congo (13.5%, a difference of 0.010%), Osage (13.4%, a difference of 0.060%), U.S. Virgin Islander (13.4%, a difference of 0.13%), Immigrants from Haiti (13.4%, a difference of 0.35%), and Comanche (13.5%, a difference of 0.49%).
| Demographics | Rating | Rank | Divorced or Separated |
| Cree | 0.0 /100 | #318 | Tragic 13.4% |
| Puget Sound Salish | 0.0 /100 | #319 | Tragic 13.4% |
| Cajuns | 0.0 /100 | #320 | Tragic 13.4% |
| Cheyenne | 0.0 /100 | #321 | Tragic 13.4% |
| Immigrants | Haiti | 0.0 /100 | #322 | Tragic 13.4% |
| U.S. Virgin Islanders | 0.0 /100 | #323 | Tragic 13.4% |
| Osage | 0.0 /100 | #324 | Tragic 13.4% |
| Potawatomi | 0.0 /100 | #325 | Tragic 13.5% |
| Immigrants | Congo | 0.0 /100 | #326 | Tragic 13.5% |
| Comanche | 0.0 /100 | #327 | Tragic 13.5% |
| Immigrants | Caribbean | 0.0 /100 | #328 | Tragic 13.6% |
| Houma | 0.0 /100 | #329 | Tragic 13.6% |
| Paiute | 0.0 /100 | #330 | Tragic 13.6% |
| Blacks/African Americans | 0.0 /100 | #331 | Tragic 13.6% |
| Cherokee | 0.0 /100 | #332 | Tragic 13.7% |