Yugoslavian vs Brazilian Divorced or Separated
COMPARE
Yugoslavian
Brazilian
Divorced or Separated
Divorced or Separated Comparison
Yugoslavians
Brazilians
12.3%
DIVORCED OR SEPARATED
6.6/ 100
METRIC RATING
231st/ 347
METRIC RANK
12.1%
DIVORCED OR SEPARATED
47.7/ 100
METRIC RATING
177th/ 347
METRIC RANK
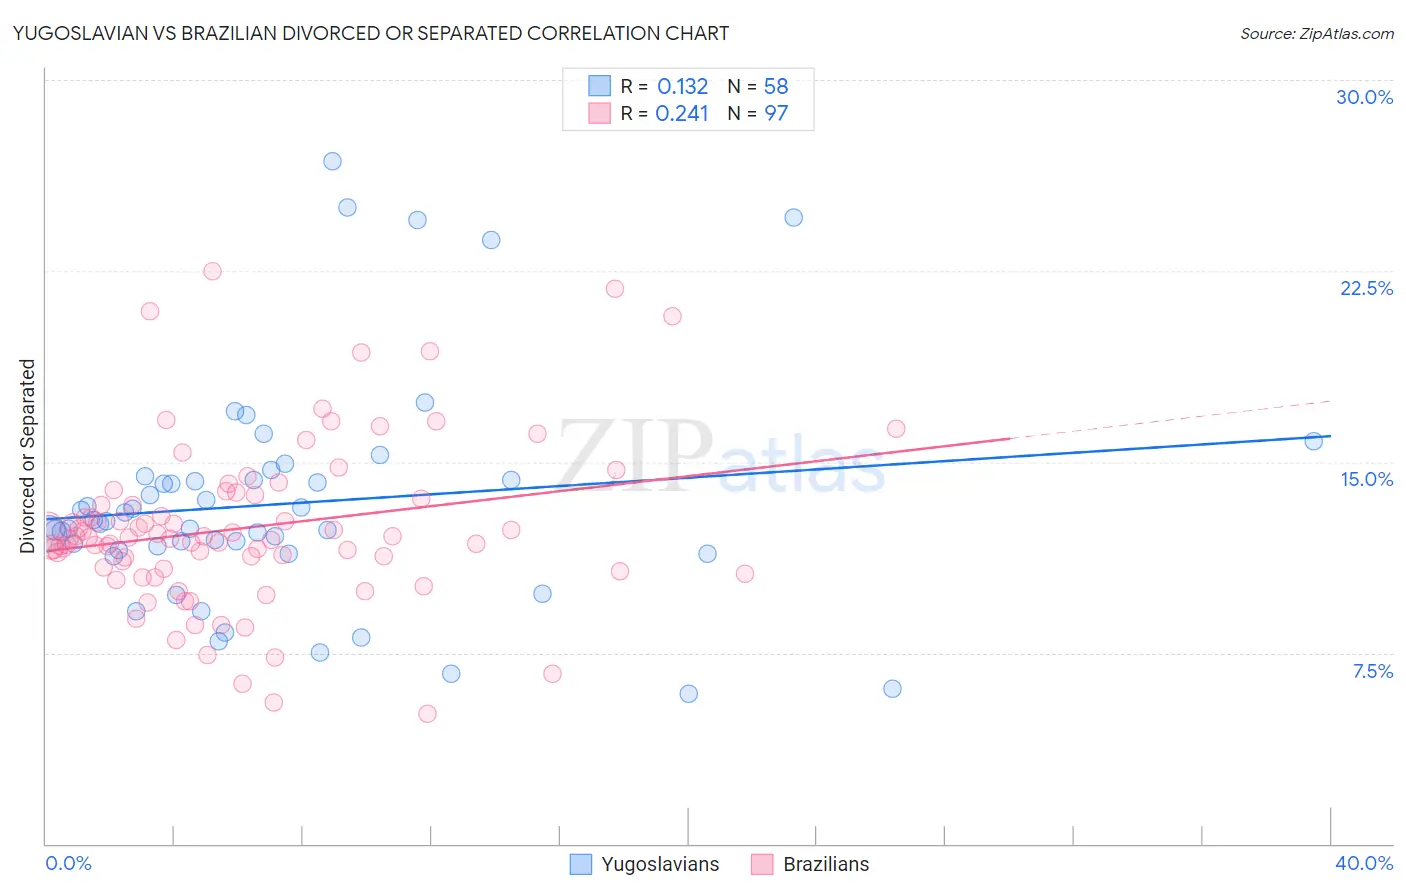
Yugoslavian vs Brazilian Divorced or Separated Correlation Chart
The statistical analysis conducted on geographies consisting of 285,666,571 people shows a poor positive correlation between the proportion of Yugoslavians and percentage of population currently divorced or separated in the United States with a correlation coefficient (R) of 0.132 and weighted average of 12.3%. Similarly, the statistical analysis conducted on geographies consisting of 323,792,537 people shows a weak positive correlation between the proportion of Brazilians and percentage of population currently divorced or separated in the United States with a correlation coefficient (R) of 0.241 and weighted average of 12.1%, a difference of 2.2%.
Divorced or Separated Correlation Summary
| Measurement | Yugoslavian | Brazilian |
| Minimum | 5.9% | 5.1% |
| Maximum | 26.8% | 22.5% |
| Range | 20.9% | 17.4% |
| Mean | 13.4% | 12.4% |
| Median | 12.6% | 12.1% |
| Interquartile 25% (IQ1) | 11.5% | 10.8% |
| Interquartile 75% (IQ3) | 14.3% | 13.6% |
| Interquartile Range (IQR) | 2.8% | 2.8% |
| Standard Deviation (Sample) | 4.4% | 3.2% |
| Standard Deviation (Population) | 4.4% | 3.2% |
Similar Demographics by Divorced or Separated
Demographics Similar to Yugoslavians by Divorced or Separated
In terms of divorced or separated, the demographic groups most similar to Yugoslavians are Yakama (12.3%, a difference of 0.15%), Canadian (12.4%, a difference of 0.19%), Immigrants from Sudan (12.3%, a difference of 0.20%), Immigrants from Cameroon (12.3%, a difference of 0.22%), and Hmong (12.3%, a difference of 0.27%).
| Demographics | Rating | Rank | Divorced or Separated |
| Immigrants | Azores | 9.7 /100 | #224 | Tragic 12.3% |
| Belgians | 9.7 /100 | #225 | Tragic 12.3% |
| Immigrants | Western Africa | 9.3 /100 | #226 | Tragic 12.3% |
| Hmong | 8.8 /100 | #227 | Tragic 12.3% |
| Immigrants | Cameroon | 8.3 /100 | #228 | Tragic 12.3% |
| Immigrants | Sudan | 8.2 /100 | #229 | Tragic 12.3% |
| Yakama | 7.8 /100 | #230 | Tragic 12.3% |
| Yugoslavians | 6.6 /100 | #231 | Tragic 12.3% |
| Canadians | 5.3 /100 | #232 | Tragic 12.4% |
| Malaysians | 4.8 /100 | #233 | Tragic 12.4% |
| West Indians | 4.4 /100 | #234 | Tragic 12.4% |
| Immigrants | Bosnia and Herzegovina | 4.3 /100 | #235 | Tragic 12.4% |
| Colombians | 4.2 /100 | #236 | Tragic 12.4% |
| Immigrants | Laos | 4.2 /100 | #237 | Tragic 12.4% |
| Sudanese | 4.0 /100 | #238 | Tragic 12.4% |
Demographics Similar to Brazilians by Divorced or Separated
In terms of divorced or separated, the demographic groups most similar to Brazilians are Pennsylvania German (12.1%, a difference of 0.040%), Ghanaian (12.1%, a difference of 0.060%), Hawaiian (12.1%, a difference of 0.080%), Immigrants from Sierra Leone (12.1%, a difference of 0.080%), and Immigrants from Western Europe (12.1%, a difference of 0.080%).
| Demographics | Rating | Rank | Divorced or Separated |
| Mexican American Indians | 55.8 /100 | #170 | Average 12.0% |
| Costa Ricans | 53.3 /100 | #171 | Average 12.0% |
| Immigrants | Mexico | 53.2 /100 | #172 | Average 12.0% |
| Immigrants | Moldova | 50.4 /100 | #173 | Average 12.1% |
| Hawaiians | 50.0 /100 | #174 | Average 12.1% |
| Immigrants | Sierra Leone | 50.0 /100 | #175 | Average 12.1% |
| Pennsylvania Germans | 48.9 /100 | #176 | Average 12.1% |
| Brazilians | 47.7 /100 | #177 | Average 12.1% |
| Ghanaians | 45.9 /100 | #178 | Average 12.1% |
| Immigrants | Western Europe | 45.6 /100 | #179 | Average 12.1% |
| Barbadians | 45.0 /100 | #180 | Average 12.1% |
| Immigrants | Canada | 44.0 /100 | #181 | Average 12.1% |
| Immigrants | Ethiopia | 43.1 /100 | #182 | Average 12.1% |
| Immigrants | Central America | 42.9 /100 | #183 | Average 12.1% |
| Immigrants | North America | 41.1 /100 | #184 | Average 12.1% |