Yakama vs Trinidadian and Tobagonian Unemployment Among Ages 45 to 54 years
COMPARE
Yakama
Trinidadian and Tobagonian
Unemployment Among Ages 45 to 54 years
Unemployment Among Ages 45 to 54 years Comparison
Yakama
Trinidadians and Tobagonians
5.7%
UNEMPLOYMENT AMONG AGES 45 TO 54 YEARS
0.0/ 100
METRIC RATING
321st/ 347
METRIC RANK
5.2%
UNEMPLOYMENT AMONG AGES 45 TO 54 YEARS
0.0/ 100
METRIC RATING
292nd/ 347
METRIC RANK
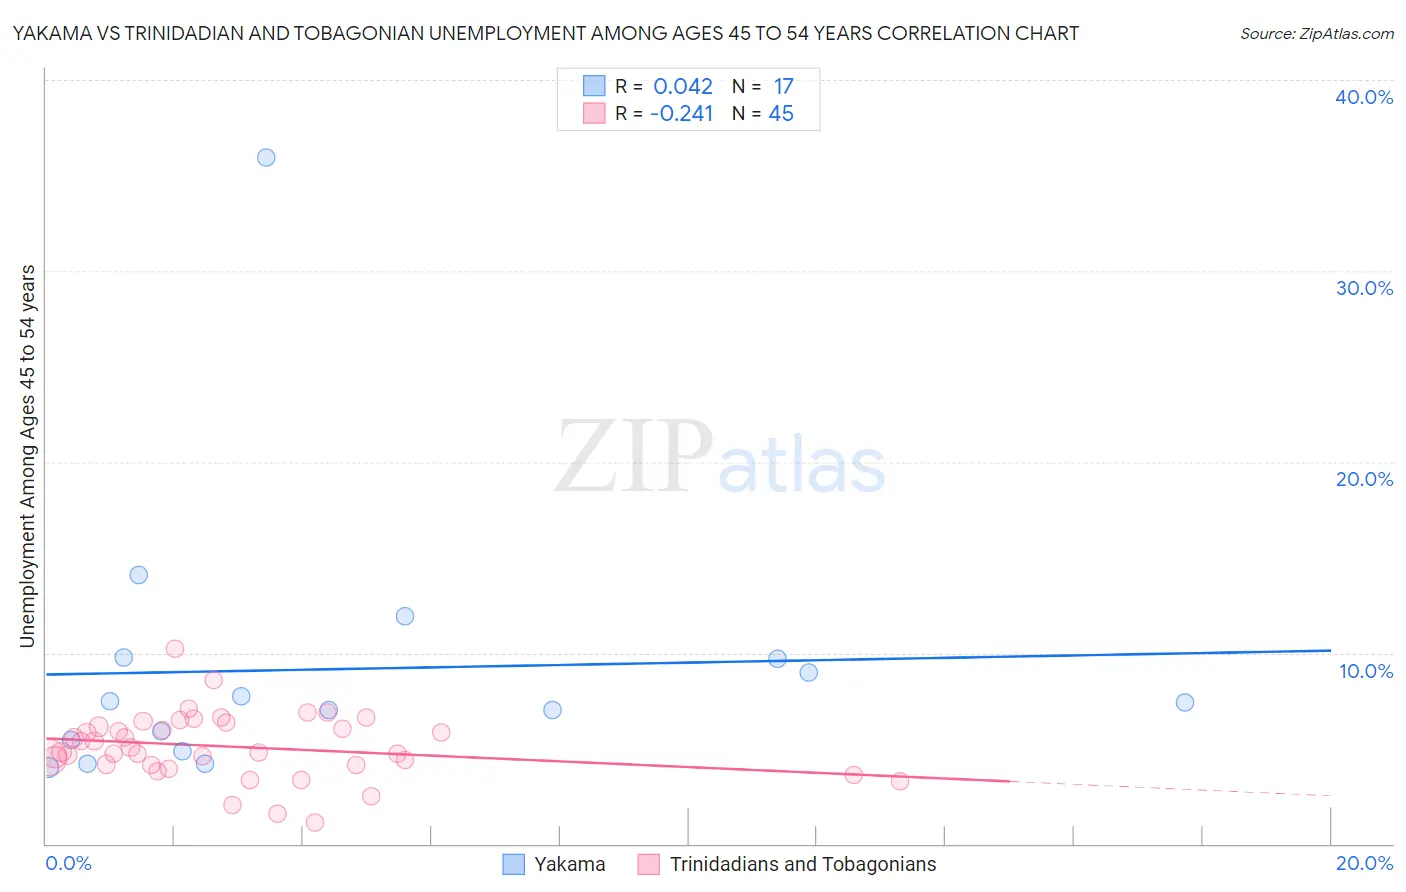
Yakama vs Trinidadian and Tobagonian Unemployment Among Ages 45 to 54 years Correlation Chart
The statistical analysis conducted on geographies consisting of 19,676,341 people shows no correlation between the proportion of Yakama and unemployment rate among population between the ages 45 and 54 in the United States with a correlation coefficient (R) of 0.042 and weighted average of 5.7%. Similarly, the statistical analysis conducted on geographies consisting of 216,980,624 people shows a weak negative correlation between the proportion of Trinidadians and Tobagonians and unemployment rate among population between the ages 45 and 54 in the United States with a correlation coefficient (R) of -0.241 and weighted average of 5.2%, a difference of 9.7%.
Unemployment Among Ages 45 to 54 years Correlation Summary
| Measurement | Yakama | Trinidadian and Tobagonian |
| Minimum | 4.0% | 1.1% |
| Maximum | 36.0% | 10.2% |
| Range | 32.0% | 9.1% |
| Mean | 9.1% | 5.1% |
| Median | 7.4% | 4.8% |
| Interquartile 25% (IQ1) | 5.1% | 4.1% |
| Interquartile 75% (IQ3) | 9.7% | 6.2% |
| Interquartile Range (IQR) | 4.6% | 2.1% |
| Standard Deviation (Sample) | 7.4% | 1.7% |
| Standard Deviation (Population) | 7.2% | 1.7% |
Similar Demographics by Unemployment Among Ages 45 to 54 years
Demographics Similar to Yakama by Unemployment Among Ages 45 to 54 years
In terms of unemployment among ages 45 to 54 years, the demographic groups most similar to Yakama are Immigrants from St. Vincent and the Grenadines (5.7%, a difference of 0.35%), Cape Verdean (5.7%, a difference of 0.36%), Immigrants from the Azores (5.7%, a difference of 0.51%), British West Indian (5.7%, a difference of 0.90%), and Houma (5.6%, a difference of 1.5%).
| Demographics | Rating | Rank | Unemployment Among Ages 45 to 54 years |
| Guyanese | 0.0 /100 | #314 | Tragic 5.6% |
| Immigrants | Dominica | 0.0 /100 | #315 | Tragic 5.6% |
| Immigrants | Guyana | 0.0 /100 | #316 | Tragic 5.6% |
| Houma | 0.0 /100 | #317 | Tragic 5.6% |
| British West Indians | 0.0 /100 | #318 | Tragic 5.7% |
| Cape Verdeans | 0.0 /100 | #319 | Tragic 5.7% |
| Immigrants | St. Vincent and the Grenadines | 0.0 /100 | #320 | Tragic 5.7% |
| Yakama | 0.0 /100 | #321 | Tragic 5.7% |
| Immigrants | Azores | 0.0 /100 | #322 | Tragic 5.7% |
| Immigrants | Cabo Verde | 0.0 /100 | #323 | Tragic 5.9% |
| Natives/Alaskans | 0.0 /100 | #324 | Tragic 6.1% |
| Immigrants | Armenia | 0.0 /100 | #325 | Tragic 6.1% |
| Ute | 0.0 /100 | #326 | Tragic 6.2% |
| Dominicans | 0.0 /100 | #327 | Tragic 6.2% |
| Pueblo | 0.0 /100 | #328 | Tragic 6.2% |
Demographics Similar to Trinidadians and Tobagonians by Unemployment Among Ages 45 to 54 years
In terms of unemployment among ages 45 to 54 years, the demographic groups most similar to Trinidadians and Tobagonians are Immigrants from Senegal (5.2%, a difference of 0.010%), Immigrants from Portugal (5.2%, a difference of 0.24%), Armenian (5.2%, a difference of 0.24%), Immigrants from Haiti (5.2%, a difference of 0.40%), and Belizean (5.2%, a difference of 0.59%).
| Demographics | Rating | Rank | Unemployment Among Ages 45 to 54 years |
| Iroquois | 0.0 /100 | #285 | Tragic 5.1% |
| Senegalese | 0.0 /100 | #286 | Tragic 5.1% |
| Haitians | 0.0 /100 | #287 | Tragic 5.2% |
| Immigrants | Caribbean | 0.0 /100 | #288 | Tragic 5.2% |
| Immigrants | Haiti | 0.0 /100 | #289 | Tragic 5.2% |
| Immigrants | Portugal | 0.0 /100 | #290 | Tragic 5.2% |
| Armenians | 0.0 /100 | #291 | Tragic 5.2% |
| Trinidadians and Tobagonians | 0.0 /100 | #292 | Tragic 5.2% |
| Immigrants | Senegal | 0.0 /100 | #293 | Tragic 5.2% |
| Belizeans | 0.0 /100 | #294 | Tragic 5.2% |
| Jamaicans | 0.0 /100 | #295 | Tragic 5.3% |
| Aleuts | 0.0 /100 | #296 | Tragic 5.3% |
| West Indians | 0.0 /100 | #297 | Tragic 5.3% |
| Immigrants | Trinidad and Tobago | 0.0 /100 | #298 | Tragic 5.3% |
| Ecuadorians | 0.0 /100 | #299 | Tragic 5.3% |