Yakama vs Immigrants from Southern Europe Family Households
COMPARE
Yakama
Immigrants from Southern Europe
Family Households
Family Households Comparison
Yakama
Immigrants from Southern Europe
69.3%
FAMILY HOUSEHOLDS
100.0/ 100
METRIC RATING
4th/ 347
METRIC RANK
64.4%
FAMILY HOUSEHOLDS
60.0/ 100
METRIC RATING
165th/ 347
METRIC RANK
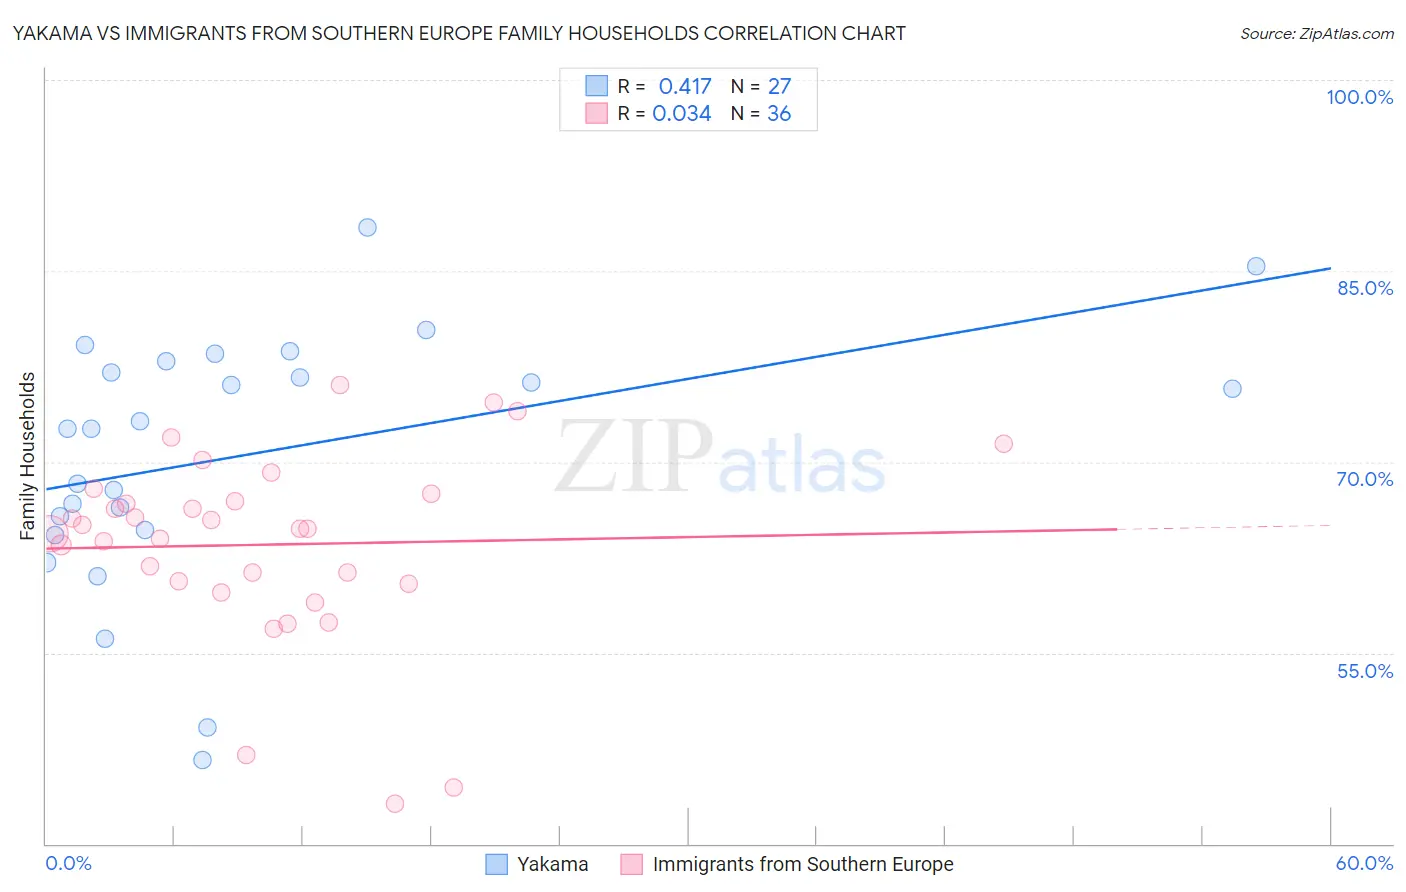
Yakama vs Immigrants from Southern Europe Family Households Correlation Chart
The statistical analysis conducted on geographies consisting of 19,917,879 people shows a moderate positive correlation between the proportion of Yakama and percentage of family households in the United States with a correlation coefficient (R) of 0.417 and weighted average of 69.3%. Similarly, the statistical analysis conducted on geographies consisting of 402,628,805 people shows no correlation between the proportion of Immigrants from Southern Europe and percentage of family households in the United States with a correlation coefficient (R) of 0.034 and weighted average of 64.4%, a difference of 7.6%.
Family Households Correlation Summary
| Measurement | Yakama | Immigrants from Southern Europe |
| Minimum | 46.6% | 43.1% |
| Maximum | 88.5% | 76.0% |
| Range | 41.9% | 32.9% |
| Mean | 70.6% | 63.5% |
| Median | 72.6% | 64.7% |
| Interquartile 25% (IQ1) | 64.6% | 60.5% |
| Interquartile 75% (IQ3) | 77.9% | 67.2% |
| Interquartile Range (IQR) | 13.3% | 6.7% |
| Standard Deviation (Sample) | 10.1% | 7.4% |
| Standard Deviation (Population) | 9.9% | 7.3% |
Similar Demographics by Family Households
Demographics Similar to Yakama by Family Households
In terms of family households, the demographic groups most similar to Yakama are Yuman (69.3%, a difference of 0.030%), Immigrants from Mexico (69.1%, a difference of 0.26%), Tongan (69.6%, a difference of 0.44%), Mexican (69.0%, a difference of 0.47%), and Immigrants from Fiji (68.8%, a difference of 0.80%).
| Demographics | Rating | Rank | Family Households |
| Yup'ik | 100 /100 | #1 | Exceptional 72.4% |
| Spanish American Indians | 100.0 /100 | #2 | Exceptional 71.2% |
| Tongans | 100.0 /100 | #3 | Exceptional 69.6% |
| Yakama | 100.0 /100 | #4 | Exceptional 69.3% |
| Yuman | 100.0 /100 | #5 | Exceptional 69.3% |
| Immigrants | Mexico | 100.0 /100 | #6 | Exceptional 69.1% |
| Mexicans | 100.0 /100 | #7 | Exceptional 69.0% |
| Immigrants | Fiji | 100.0 /100 | #8 | Exceptional 68.8% |
| Native Hawaiians | 100.0 /100 | #9 | Exceptional 68.4% |
| Immigrants | Philippines | 100.0 /100 | #10 | Exceptional 68.3% |
| Immigrants | Central America | 100.0 /100 | #11 | Exceptional 68.3% |
| Koreans | 100.0 /100 | #12 | Exceptional 68.3% |
| Pueblo | 100.0 /100 | #13 | Exceptional 68.2% |
| Immigrants | Cuba | 100.0 /100 | #14 | Exceptional 68.2% |
| Assyrians/Chaldeans/Syriacs | 100.0 /100 | #15 | Exceptional 68.2% |
Demographics Similar to Immigrants from Southern Europe by Family Households
In terms of family households, the demographic groups most similar to Immigrants from Southern Europe are Immigrants from Nigeria (64.4%, a difference of 0.0%), Scotch-Irish (64.4%, a difference of 0.010%), British (64.4%, a difference of 0.020%), Chickasaw (64.4%, a difference of 0.020%), and Irish (64.4%, a difference of 0.030%).
| Demographics | Rating | Rank | Family Households |
| Lebanese | 66.4 /100 | #158 | Good 64.4% |
| Germans | 65.8 /100 | #159 | Good 64.4% |
| Immigrants | Moldova | 65.2 /100 | #160 | Good 64.4% |
| Immigrants | England | 62.6 /100 | #161 | Good 64.4% |
| British | 61.6 /100 | #162 | Good 64.4% |
| Chickasaw | 61.5 /100 | #163 | Good 64.4% |
| Immigrants | Nigeria | 60.1 /100 | #164 | Good 64.4% |
| Immigrants | Southern Europe | 60.0 /100 | #165 | Good 64.4% |
| Scotch-Irish | 59.2 /100 | #166 | Average 64.4% |
| Irish | 57.9 /100 | #167 | Average 64.4% |
| Hondurans | 57.5 /100 | #168 | Average 64.4% |
| Iraqis | 56.0 /100 | #169 | Average 64.4% |
| Armenians | 55.9 /100 | #170 | Average 64.4% |
| Ute | 54.6 /100 | #171 | Average 64.3% |
| Dutch West Indians | 53.9 /100 | #172 | Average 64.3% |