Yakama vs Pueblo Births to Unmarried Women
COMPARE
Yakama
Pueblo
Births to Unmarried Women
Births to Unmarried Women Comparison
Yakama
Pueblo
40.3%
BIRTHS TO UNMARRIED WOMEN
0.0/ 100
METRIC RATING
319th/ 347
METRIC RANK
53.7%
BIRTHS TO UNMARRIED WOMEN
0.0/ 100
METRIC RATING
346th/ 347
METRIC RANK
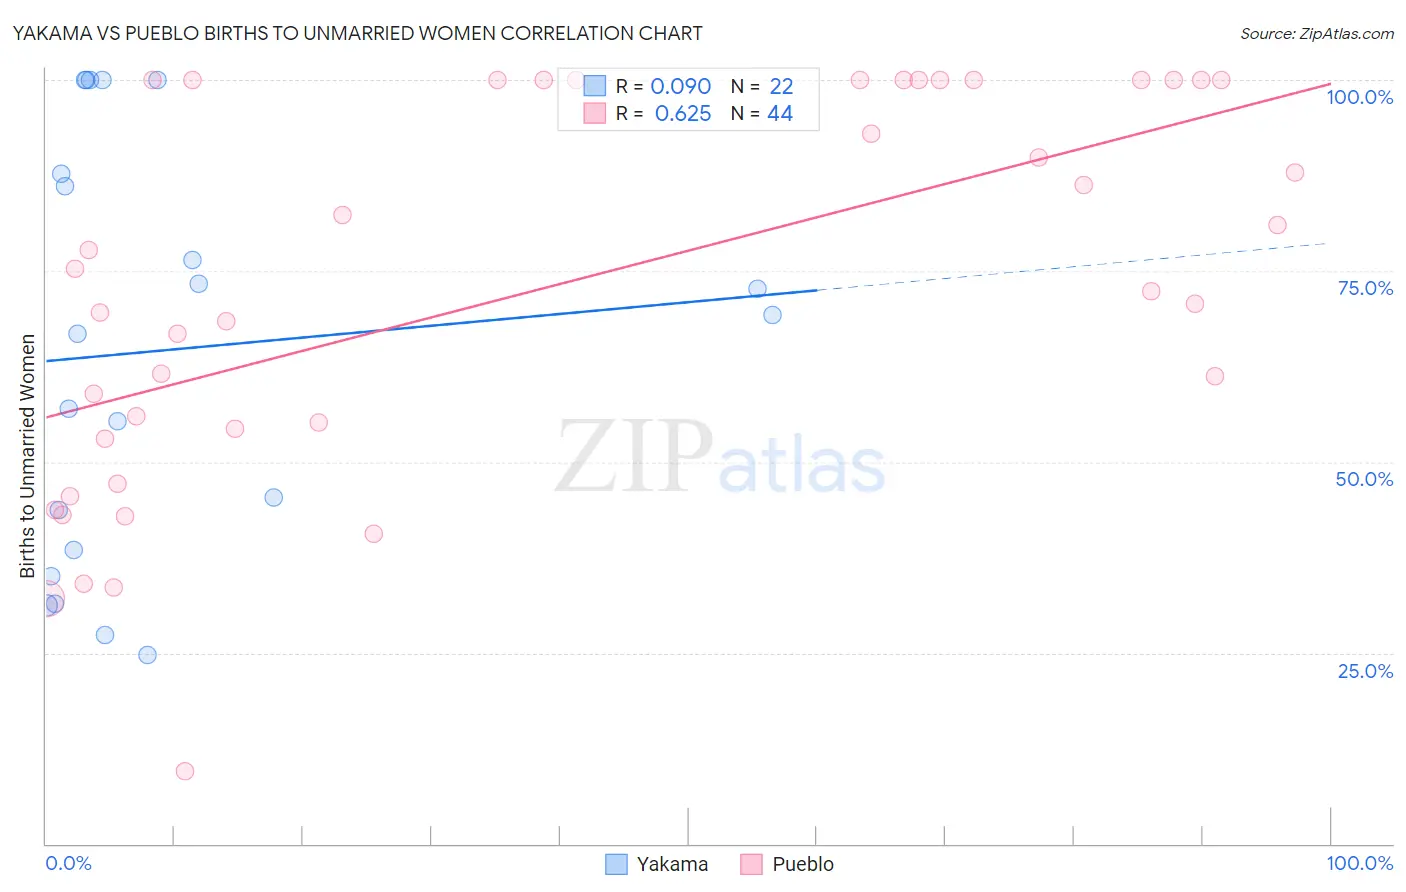
Yakama vs Pueblo Births to Unmarried Women Correlation Chart
The statistical analysis conducted on geographies consisting of 19,190,199 people shows a slight positive correlation between the proportion of Yakama and percentage of births to unmarried women in the United States with a correlation coefficient (R) of 0.090 and weighted average of 40.3%. Similarly, the statistical analysis conducted on geographies consisting of 117,205,072 people shows a significant positive correlation between the proportion of Pueblo and percentage of births to unmarried women in the United States with a correlation coefficient (R) of 0.625 and weighted average of 53.7%, a difference of 33.0%.
Births to Unmarried Women Correlation Summary
| Measurement | Yakama | Pueblo |
| Minimum | 24.7% | 9.5% |
| Maximum | 100.0% | 100.0% |
| Range | 75.3% | 90.5% |
| Mean | 64.6% | 72.6% |
| Median | 67.9% | 73.8% |
| Interquartile 25% (IQ1) | 38.5% | 53.7% |
| Interquartile 75% (IQ3) | 87.8% | 100.0% |
| Interquartile Range (IQR) | 49.3% | 46.3% |
| Standard Deviation (Sample) | 27.0% | 25.2% |
| Standard Deviation (Population) | 26.3% | 24.9% |
Similar Demographics by Births to Unmarried Women
Demographics Similar to Yakama by Births to Unmarried Women
In terms of births to unmarried women, the demographic groups most similar to Yakama are Crow (40.4%, a difference of 0.060%), Immigrants from Bahamas (40.1%, a difference of 0.56%), Immigrants from Dominican Republic (40.1%, a difference of 0.62%), Bahamian (40.8%, a difference of 1.1%), and Apache (39.9%, a difference of 1.2%).
| Demographics | Rating | Rank | Births to Unmarried Women |
| U.S. Virgin Islanders | 0.0 /100 | #312 | Tragic 39.6% |
| Africans | 0.0 /100 | #313 | Tragic 39.7% |
| Immigrants | Caribbean | 0.0 /100 | #314 | Tragic 39.8% |
| Dominicans | 0.0 /100 | #315 | Tragic 39.8% |
| Apache | 0.0 /100 | #316 | Tragic 39.9% |
| Immigrants | Dominican Republic | 0.0 /100 | #317 | Tragic 40.1% |
| Immigrants | Bahamas | 0.0 /100 | #318 | Tragic 40.1% |
| Yakama | 0.0 /100 | #319 | Tragic 40.3% |
| Crow | 0.0 /100 | #320 | Tragic 40.4% |
| Bahamians | 0.0 /100 | #321 | Tragic 40.8% |
| Cajuns | 0.0 /100 | #322 | Tragic 41.0% |
| Sioux | 0.0 /100 | #323 | Tragic 41.0% |
| Cape Verdeans | 0.0 /100 | #324 | Tragic 41.3% |
| Cheyenne | 0.0 /100 | #325 | Tragic 41.3% |
| Immigrants | Cuba | 0.0 /100 | #326 | Tragic 41.5% |
Demographics Similar to Pueblo by Births to Unmarried Women
In terms of births to unmarried women, the demographic groups most similar to Pueblo are Inupiat (52.1%, a difference of 3.0%), Navajo (51.5%, a difference of 4.2%), Pima (51.5%, a difference of 4.2%), Menominee (51.1%, a difference of 5.0%), and Yup'ik (56.4%, a difference of 5.2%).
| Demographics | Rating | Rank | Births to Unmarried Women |
| Blacks/African Americans | 0.0 /100 | #333 | Tragic 44.3% |
| Yuman | 0.0 /100 | #334 | Tragic 44.4% |
| Colville | 0.0 /100 | #335 | Tragic 45.3% |
| Puerto Ricans | 0.0 /100 | #336 | Tragic 45.7% |
| Houma | 0.0 /100 | #337 | Tragic 46.6% |
| Arapaho | 0.0 /100 | #338 | Tragic 47.1% |
| Lumbee | 0.0 /100 | #339 | Tragic 48.2% |
| Tohono O'odham | 0.0 /100 | #340 | Tragic 49.8% |
| Hopi | 0.0 /100 | #341 | Tragic 50.8% |
| Menominee | 0.0 /100 | #342 | Tragic 51.1% |
| Pima | 0.0 /100 | #343 | Tragic 51.5% |
| Navajo | 0.0 /100 | #344 | Tragic 51.5% |
| Inupiat | 0.0 /100 | #345 | Tragic 52.1% |
| Pueblo | 0.0 /100 | #346 | Tragic 53.7% |
| Yup'ik | 0.0 /100 | #347 | Tragic 56.4% |