Immigrants from Latvia vs Pueblo Births to Unmarried Women
COMPARE
Immigrants from Latvia
Pueblo
Births to Unmarried Women
Births to Unmarried Women Comparison
Immigrants from Latvia
Pueblo
29.1%
BIRTHS TO UNMARRIED WOMEN
96.8/ 100
METRIC RATING
90th/ 347
METRIC RANK
53.7%
BIRTHS TO UNMARRIED WOMEN
0.0/ 100
METRIC RATING
346th/ 347
METRIC RANK
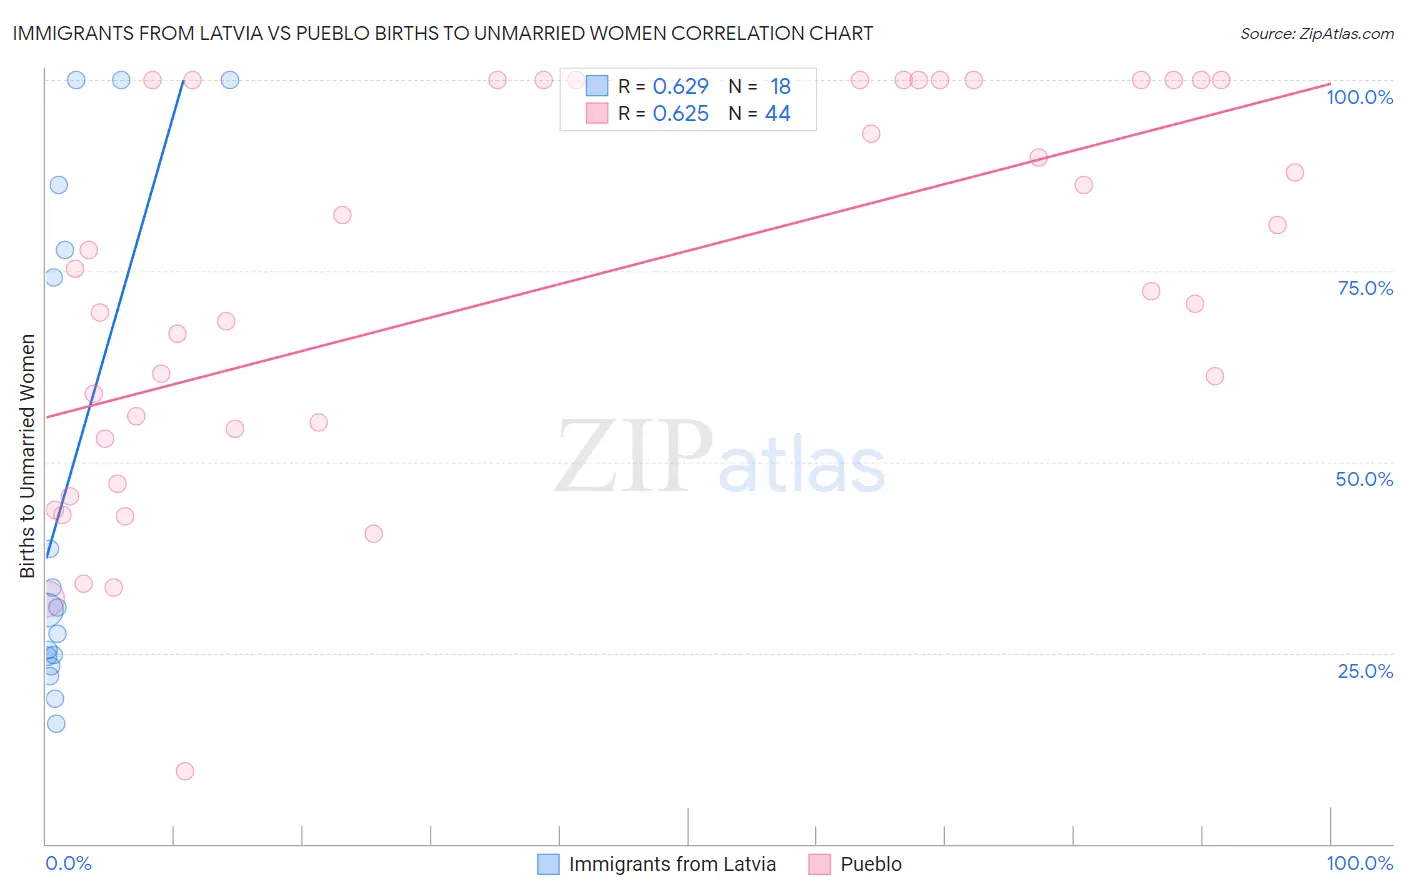
Immigrants from Latvia vs Pueblo Births to Unmarried Women Correlation Chart
The statistical analysis conducted on geographies consisting of 109,179,125 people shows a significant positive correlation between the proportion of Immigrants from Latvia and percentage of births to unmarried women in the United States with a correlation coefficient (R) of 0.629 and weighted average of 29.1%. Similarly, the statistical analysis conducted on geographies consisting of 117,205,072 people shows a significant positive correlation between the proportion of Pueblo and percentage of births to unmarried women in the United States with a correlation coefficient (R) of 0.625 and weighted average of 53.7%, a difference of 84.3%.
Births to Unmarried Women Correlation Summary
| Measurement | Immigrants from Latvia | Pueblo |
| Minimum | 15.8% | 9.5% |
| Maximum | 100.0% | 100.0% |
| Range | 84.2% | 90.5% |
| Mean | 47.4% | 72.6% |
| Median | 30.8% | 73.8% |
| Interquartile 25% (IQ1) | 24.5% | 53.7% |
| Interquartile 75% (IQ3) | 77.8% | 100.0% |
| Interquartile Range (IQR) | 53.3% | 46.3% |
| Standard Deviation (Sample) | 31.8% | 25.2% |
| Standard Deviation (Population) | 30.9% | 24.9% |
Similar Demographics by Births to Unmarried Women
Demographics Similar to Immigrants from Latvia by Births to Unmarried Women
In terms of births to unmarried women, the demographic groups most similar to Immigrants from Latvia are Immigrants from Saudi Arabia (29.1%, a difference of 0.16%), Immigrants from Fiji (29.2%, a difference of 0.21%), Arab (29.2%, a difference of 0.25%), Estonian (29.2%, a difference of 0.29%), and Ukrainian (29.2%, a difference of 0.41%).
| Demographics | Rating | Rank | Births to Unmarried Women |
| Immigrants | Kuwait | 98.0 /100 | #83 | Exceptional 28.8% |
| Immigrants | Poland | 97.6 /100 | #84 | Exceptional 28.9% |
| Sri Lankans | 97.5 /100 | #85 | Exceptional 28.9% |
| Immigrants | Jordan | 97.4 /100 | #86 | Exceptional 29.0% |
| Taiwanese | 97.3 /100 | #87 | Exceptional 29.0% |
| Immigrants | France | 97.3 /100 | #88 | Exceptional 29.0% |
| Immigrants | Saudi Arabia | 97.0 /100 | #89 | Exceptional 29.1% |
| Immigrants | Latvia | 96.8 /100 | #90 | Exceptional 29.1% |
| Immigrants | Fiji | 96.6 /100 | #91 | Exceptional 29.2% |
| Arabs | 96.5 /100 | #92 | Exceptional 29.2% |
| Estonians | 96.5 /100 | #93 | Exceptional 29.2% |
| Ukrainians | 96.3 /100 | #94 | Exceptional 29.2% |
| Immigrants | Vietnam | 96.1 /100 | #95 | Exceptional 29.3% |
| Norwegians | 95.8 /100 | #96 | Exceptional 29.3% |
| Immigrants | South Africa | 95.7 /100 | #97 | Exceptional 29.3% |
Demographics Similar to Pueblo by Births to Unmarried Women
In terms of births to unmarried women, the demographic groups most similar to Pueblo are Inupiat (52.1%, a difference of 3.0%), Navajo (51.5%, a difference of 4.2%), Pima (51.5%, a difference of 4.2%), Menominee (51.1%, a difference of 5.0%), and Yup'ik (56.4%, a difference of 5.2%).
| Demographics | Rating | Rank | Births to Unmarried Women |
| Blacks/African Americans | 0.0 /100 | #333 | Tragic 44.3% |
| Yuman | 0.0 /100 | #334 | Tragic 44.4% |
| Colville | 0.0 /100 | #335 | Tragic 45.3% |
| Puerto Ricans | 0.0 /100 | #336 | Tragic 45.7% |
| Houma | 0.0 /100 | #337 | Tragic 46.6% |
| Arapaho | 0.0 /100 | #338 | Tragic 47.1% |
| Lumbee | 0.0 /100 | #339 | Tragic 48.2% |
| Tohono O'odham | 0.0 /100 | #340 | Tragic 49.8% |
| Hopi | 0.0 /100 | #341 | Tragic 50.8% |
| Menominee | 0.0 /100 | #342 | Tragic 51.1% |
| Pima | 0.0 /100 | #343 | Tragic 51.5% |
| Navajo | 0.0 /100 | #344 | Tragic 51.5% |
| Inupiat | 0.0 /100 | #345 | Tragic 52.1% |
| Pueblo | 0.0 /100 | #346 | Tragic 53.7% |
| Yup'ik | 0.0 /100 | #347 | Tragic 56.4% |