Yakama vs Brazilian Births to Unmarried Women
COMPARE
Yakama
Brazilian
Births to Unmarried Women
Births to Unmarried Women Comparison
Yakama
Brazilians
40.3%
BIRTHS TO UNMARRIED WOMEN
0.0/ 100
METRIC RATING
319th/ 347
METRIC RANK
30.4%
BIRTHS TO UNMARRIED WOMEN
84.8/ 100
METRIC RATING
135th/ 347
METRIC RANK
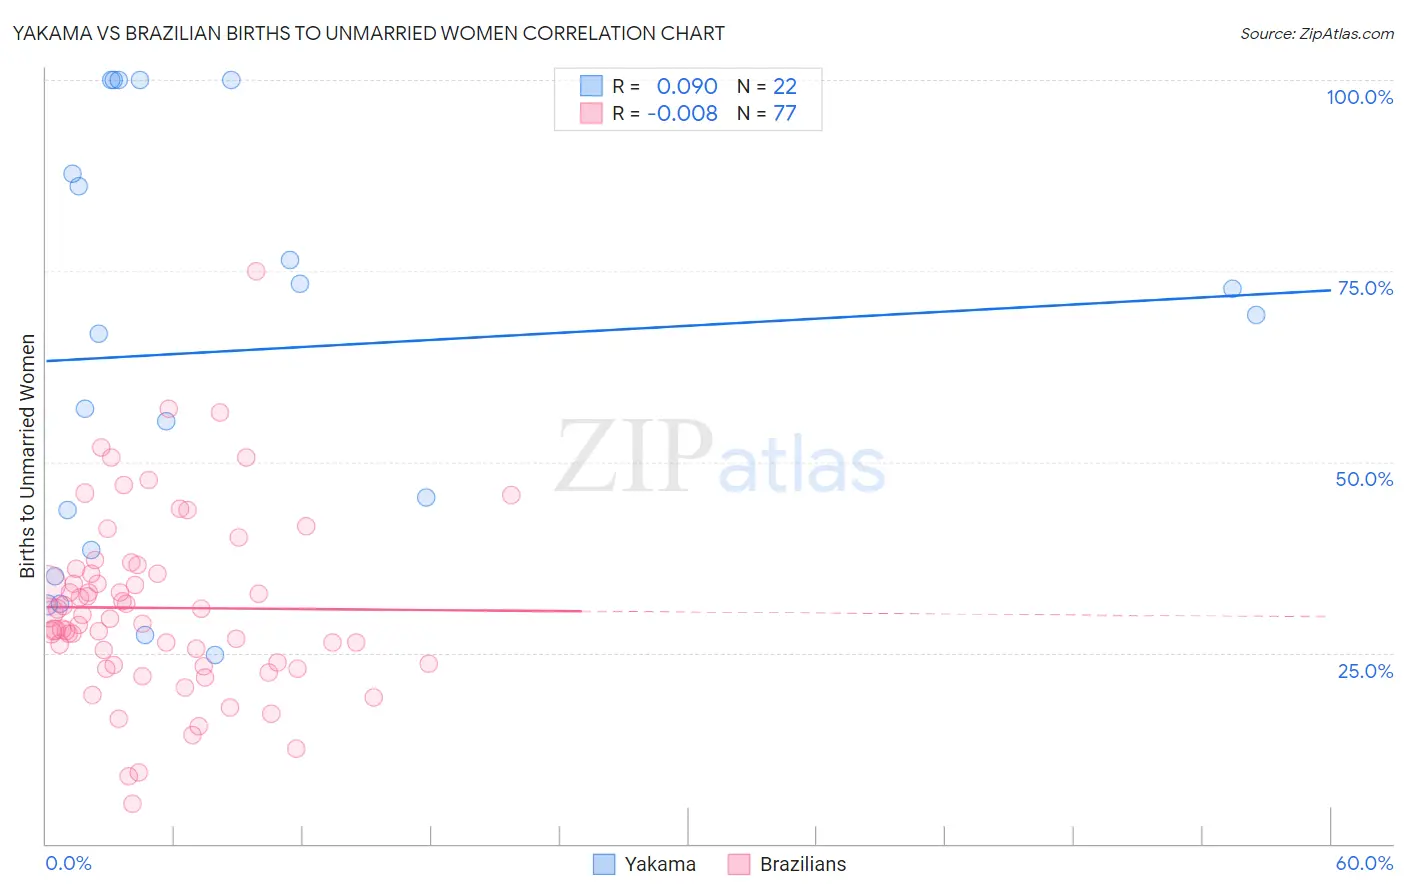
Yakama vs Brazilian Births to Unmarried Women Correlation Chart
The statistical analysis conducted on geographies consisting of 19,190,199 people shows a slight positive correlation between the proportion of Yakama and percentage of births to unmarried women in the United States with a correlation coefficient (R) of 0.090 and weighted average of 40.3%. Similarly, the statistical analysis conducted on geographies consisting of 304,585,920 people shows no correlation between the proportion of Brazilians and percentage of births to unmarried women in the United States with a correlation coefficient (R) of -0.008 and weighted average of 30.4%, a difference of 32.8%.
Births to Unmarried Women Correlation Summary
| Measurement | Yakama | Brazilian |
| Minimum | 24.7% | 5.3% |
| Maximum | 100.0% | 74.9% |
| Range | 75.3% | 69.6% |
| Mean | 64.6% | 30.9% |
| Median | 67.9% | 29.4% |
| Interquartile 25% (IQ1) | 38.5% | 23.4% |
| Interquartile 75% (IQ3) | 87.8% | 35.7% |
| Interquartile Range (IQR) | 49.3% | 12.3% |
| Standard Deviation (Sample) | 27.0% | 11.8% |
| Standard Deviation (Population) | 26.3% | 11.7% |
Similar Demographics by Births to Unmarried Women
Demographics Similar to Yakama by Births to Unmarried Women
In terms of births to unmarried women, the demographic groups most similar to Yakama are Crow (40.4%, a difference of 0.060%), Immigrants from Bahamas (40.1%, a difference of 0.56%), Immigrants from Dominican Republic (40.1%, a difference of 0.62%), Bahamian (40.8%, a difference of 1.1%), and Apache (39.9%, a difference of 1.2%).
| Demographics | Rating | Rank | Births to Unmarried Women |
| U.S. Virgin Islanders | 0.0 /100 | #312 | Tragic 39.6% |
| Africans | 0.0 /100 | #313 | Tragic 39.7% |
| Immigrants | Caribbean | 0.0 /100 | #314 | Tragic 39.8% |
| Dominicans | 0.0 /100 | #315 | Tragic 39.8% |
| Apache | 0.0 /100 | #316 | Tragic 39.9% |
| Immigrants | Dominican Republic | 0.0 /100 | #317 | Tragic 40.1% |
| Immigrants | Bahamas | 0.0 /100 | #318 | Tragic 40.1% |
| Yakama | 0.0 /100 | #319 | Tragic 40.3% |
| Crow | 0.0 /100 | #320 | Tragic 40.4% |
| Bahamians | 0.0 /100 | #321 | Tragic 40.8% |
| Cajuns | 0.0 /100 | #322 | Tragic 41.0% |
| Sioux | 0.0 /100 | #323 | Tragic 41.0% |
| Cape Verdeans | 0.0 /100 | #324 | Tragic 41.3% |
| Cheyenne | 0.0 /100 | #325 | Tragic 41.3% |
| Immigrants | Cuba | 0.0 /100 | #326 | Tragic 41.5% |
Demographics Similar to Brazilians by Births to Unmarried Women
In terms of births to unmarried women, the demographic groups most similar to Brazilians are Immigrants from Scotland (30.4%, a difference of 0.030%), Immigrants from South Eastern Asia (30.4%, a difference of 0.070%), Immigrants from Morocco (30.4%, a difference of 0.080%), New Zealander (30.3%, a difference of 0.13%), and Immigrants from Zimbabwe (30.3%, a difference of 0.16%).
| Demographics | Rating | Rank | Births to Unmarried Women |
| Icelanders | 86.0 /100 | #128 | Excellent 30.3% |
| Immigrants | Spain | 85.8 /100 | #129 | Excellent 30.3% |
| Immigrants | Bosnia and Herzegovina | 85.7 /100 | #130 | Excellent 30.3% |
| Immigrants | Zimbabwe | 85.7 /100 | #131 | Excellent 30.3% |
| New Zealanders | 85.5 /100 | #132 | Excellent 30.3% |
| Immigrants | Morocco | 85.2 /100 | #133 | Excellent 30.4% |
| Immigrants | South Eastern Asia | 85.2 /100 | #134 | Excellent 30.4% |
| Brazilians | 84.8 /100 | #135 | Excellent 30.4% |
| Immigrants | Scotland | 84.6 /100 | #136 | Excellent 30.4% |
| Immigrants | Philippines | 83.9 /100 | #137 | Excellent 30.4% |
| Puget Sound Salish | 83.9 /100 | #138 | Excellent 30.4% |
| Immigrants | Canada | 83.7 /100 | #139 | Excellent 30.4% |
| Swiss | 83.1 /100 | #140 | Excellent 30.5% |
| Pakistanis | 83.0 /100 | #141 | Excellent 30.5% |
| South Africans | 82.7 /100 | #142 | Excellent 30.5% |