Yakama vs Slovene Births to Unmarried Women
COMPARE
Yakama
Slovene
Births to Unmarried Women
Births to Unmarried Women Comparison
Yakama
Slovenes
40.3%
BIRTHS TO UNMARRIED WOMEN
0.0/ 100
METRIC RATING
319th/ 347
METRIC RANK
31.2%
BIRTHS TO UNMARRIED WOMEN
65.9/ 100
METRIC RATING
162nd/ 347
METRIC RANK
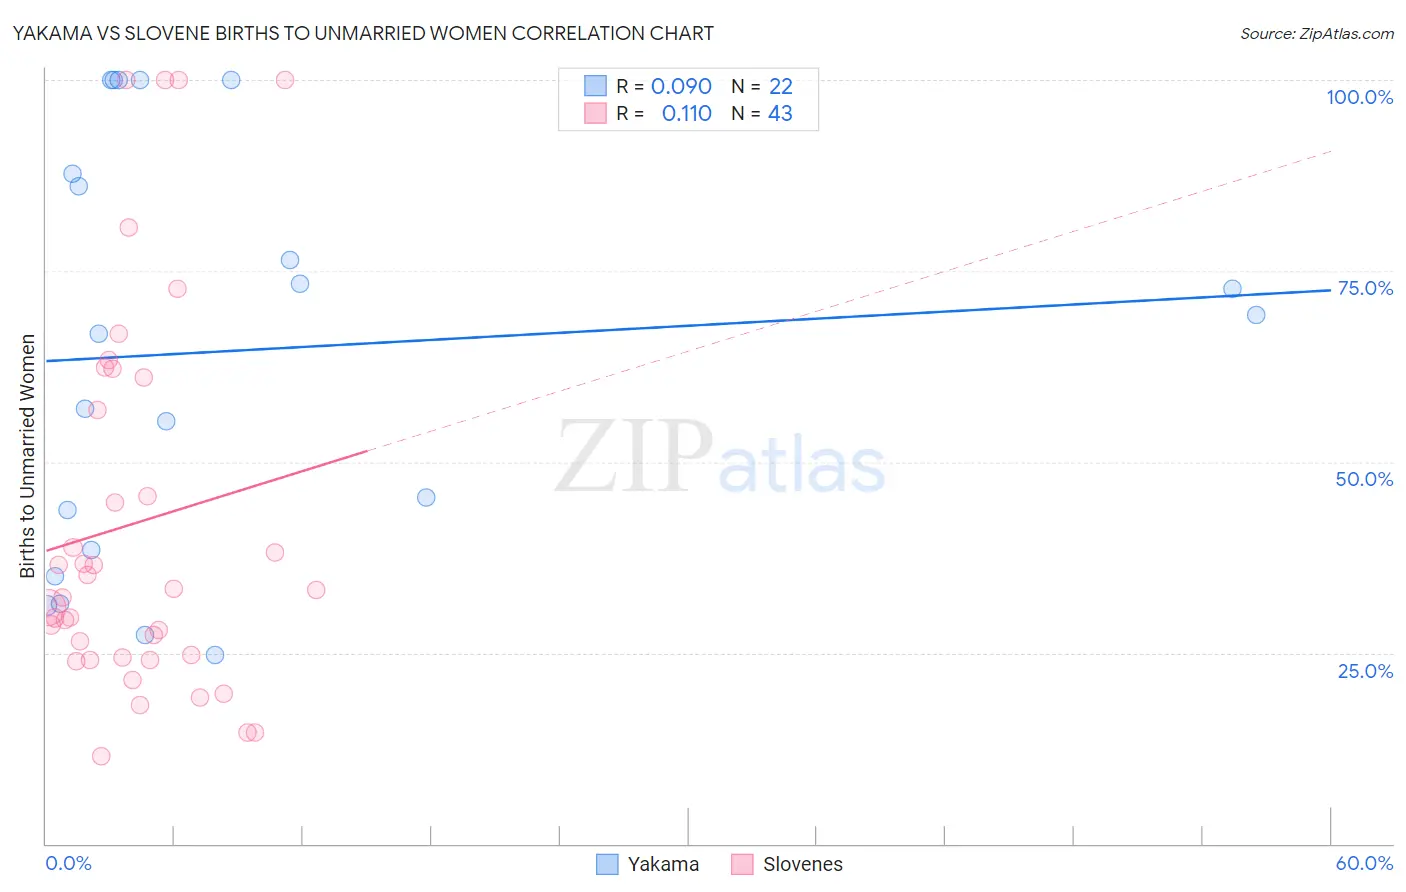
Yakama vs Slovene Births to Unmarried Women Correlation Chart
The statistical analysis conducted on geographies consisting of 19,190,199 people shows a slight positive correlation between the proportion of Yakama and percentage of births to unmarried women in the United States with a correlation coefficient (R) of 0.090 and weighted average of 40.3%. Similarly, the statistical analysis conducted on geographies consisting of 244,653,742 people shows a poor positive correlation between the proportion of Slovenes and percentage of births to unmarried women in the United States with a correlation coefficient (R) of 0.110 and weighted average of 31.2%, a difference of 29.4%.
Births to Unmarried Women Correlation Summary
| Measurement | Yakama | Slovene |
| Minimum | 24.7% | 11.4% |
| Maximum | 100.0% | 100.0% |
| Range | 75.3% | 88.6% |
| Mean | 64.6% | 42.0% |
| Median | 67.9% | 33.3% |
| Interquartile 25% (IQ1) | 38.5% | 24.4% |
| Interquartile 75% (IQ3) | 87.8% | 61.0% |
| Interquartile Range (IQR) | 49.3% | 36.7% |
| Standard Deviation (Sample) | 27.0% | 25.0% |
| Standard Deviation (Population) | 26.3% | 24.7% |
Similar Demographics by Births to Unmarried Women
Demographics Similar to Yakama by Births to Unmarried Women
In terms of births to unmarried women, the demographic groups most similar to Yakama are Crow (40.4%, a difference of 0.060%), Immigrants from Bahamas (40.1%, a difference of 0.56%), Immigrants from Dominican Republic (40.1%, a difference of 0.62%), Bahamian (40.8%, a difference of 1.1%), and Apache (39.9%, a difference of 1.2%).
| Demographics | Rating | Rank | Births to Unmarried Women |
| U.S. Virgin Islanders | 0.0 /100 | #312 | Tragic 39.6% |
| Africans | 0.0 /100 | #313 | Tragic 39.7% |
| Immigrants | Caribbean | 0.0 /100 | #314 | Tragic 39.8% |
| Dominicans | 0.0 /100 | #315 | Tragic 39.8% |
| Apache | 0.0 /100 | #316 | Tragic 39.9% |
| Immigrants | Dominican Republic | 0.0 /100 | #317 | Tragic 40.1% |
| Immigrants | Bahamas | 0.0 /100 | #318 | Tragic 40.1% |
| Yakama | 0.0 /100 | #319 | Tragic 40.3% |
| Crow | 0.0 /100 | #320 | Tragic 40.4% |
| Bahamians | 0.0 /100 | #321 | Tragic 40.8% |
| Cajuns | 0.0 /100 | #322 | Tragic 41.0% |
| Sioux | 0.0 /100 | #323 | Tragic 41.0% |
| Cape Verdeans | 0.0 /100 | #324 | Tragic 41.3% |
| Cheyenne | 0.0 /100 | #325 | Tragic 41.3% |
| Immigrants | Cuba | 0.0 /100 | #326 | Tragic 41.5% |
Demographics Similar to Slovenes by Births to Unmarried Women
In terms of births to unmarried women, the demographic groups most similar to Slovenes are Immigrants from Chile (31.2%, a difference of 0.020%), Hungarian (31.2%, a difference of 0.19%), Immigrants from Southern Europe (31.1%, a difference of 0.31%), Immigrants from England (31.1%, a difference of 0.38%), and Immigrants from Western Europe (31.1%, a difference of 0.38%).
| Demographics | Rating | Rank | Births to Unmarried Women |
| Immigrants | Bangladesh | 73.9 /100 | #155 | Good 30.9% |
| Carpatho Rusyns | 73.5 /100 | #156 | Good 30.9% |
| Immigrants | Eastern Africa | 72.1 /100 | #157 | Good 31.0% |
| Austrians | 69.9 /100 | #158 | Good 31.0% |
| Immigrants | England | 69.4 /100 | #159 | Good 31.1% |
| Immigrants | Western Europe | 69.3 /100 | #160 | Good 31.1% |
| Immigrants | Southern Europe | 68.7 /100 | #161 | Good 31.1% |
| Slovenes | 65.9 /100 | #162 | Good 31.2% |
| Immigrants | Chile | 65.7 /100 | #163 | Good 31.2% |
| Hungarians | 64.1 /100 | #164 | Good 31.2% |
| Immigrants | Somalia | 58.1 /100 | #165 | Average 31.4% |
| Peruvians | 55.5 /100 | #166 | Average 31.5% |
| Dutch | 55.3 /100 | #167 | Average 31.5% |
| Belgians | 52.4 /100 | #168 | Average 31.6% |
| Slavs | 52.0 /100 | #169 | Average 31.6% |