Yakama vs Immigrants from West Indies Births to Unmarried Women
COMPARE
Yakama
Immigrants from West Indies
Births to Unmarried Women
Births to Unmarried Women Comparison
Yakama
Immigrants from West Indies
40.3%
BIRTHS TO UNMARRIED WOMEN
0.0/ 100
METRIC RATING
319th/ 347
METRIC RANK
38.6%
BIRTHS TO UNMARRIED WOMEN
0.0/ 100
METRIC RATING
300th/ 347
METRIC RANK
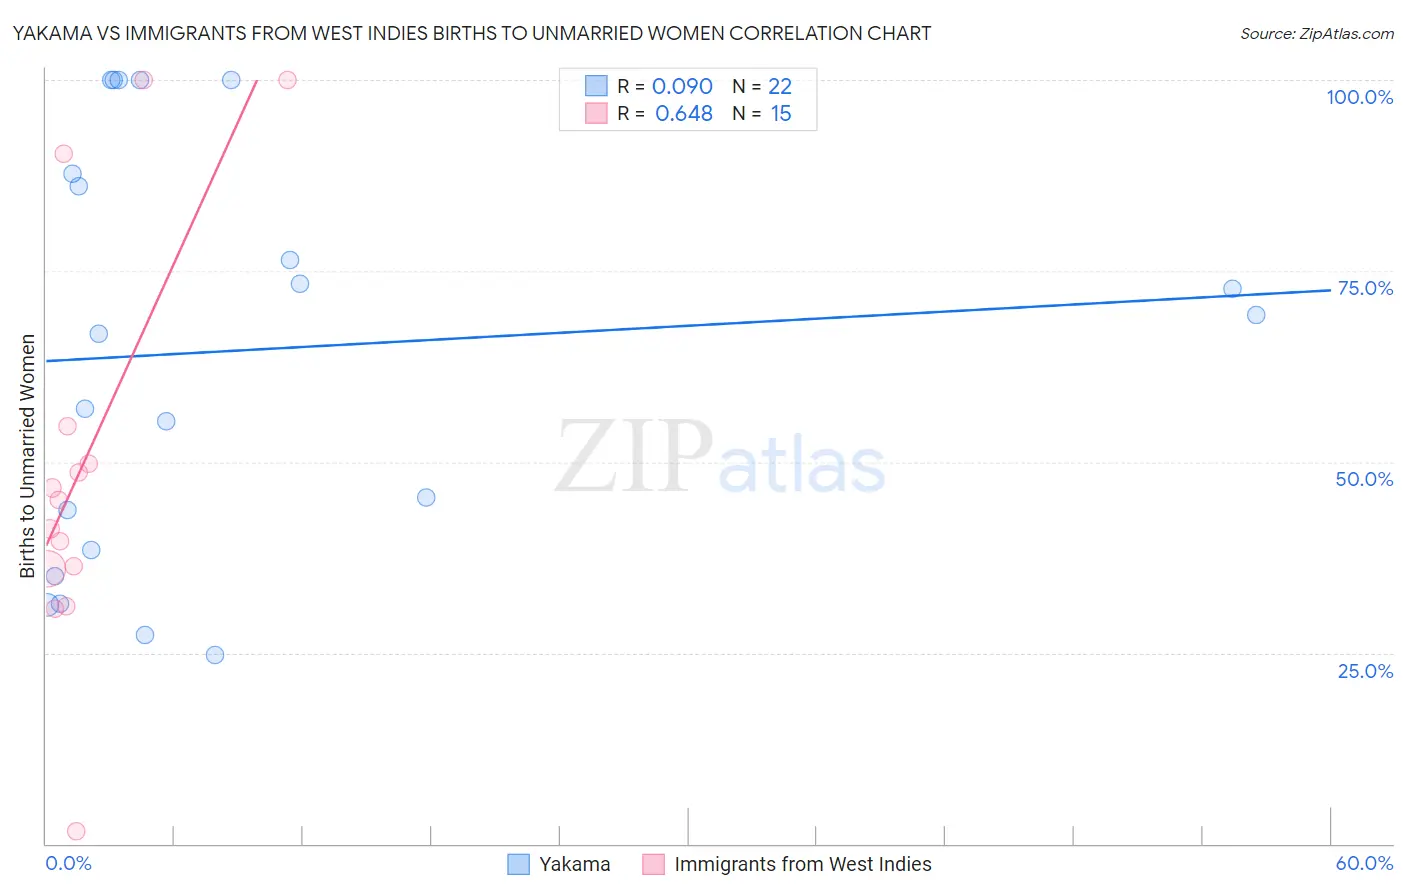
Yakama vs Immigrants from West Indies Births to Unmarried Women Correlation Chart
The statistical analysis conducted on geographies consisting of 19,190,199 people shows a slight positive correlation between the proportion of Yakama and percentage of births to unmarried women in the United States with a correlation coefficient (R) of 0.090 and weighted average of 40.3%. Similarly, the statistical analysis conducted on geographies consisting of 71,872,007 people shows a significant positive correlation between the proportion of Immigrants from West Indies and percentage of births to unmarried women in the United States with a correlation coefficient (R) of 0.648 and weighted average of 38.6%, a difference of 4.6%.
Births to Unmarried Women Correlation Summary
| Measurement | Yakama | Immigrants from West Indies |
| Minimum | 24.7% | 1.6% |
| Maximum | 100.0% | 100.0% |
| Range | 75.3% | 98.4% |
| Mean | 64.6% | 50.1% |
| Median | 67.9% | 44.9% |
| Interquartile 25% (IQ1) | 38.5% | 36.0% |
| Interquartile 75% (IQ3) | 87.8% | 54.6% |
| Interquartile Range (IQR) | 49.3% | 18.6% |
| Standard Deviation (Sample) | 27.0% | 27.2% |
| Standard Deviation (Population) | 26.3% | 26.2% |
Demographics Similar to Yakama and Immigrants from West Indies by Births to Unmarried Women
In terms of births to unmarried women, the demographic groups most similar to Yakama are Immigrants from Bahamas (40.1%, a difference of 0.56%), Immigrants from Dominican Republic (40.1%, a difference of 0.62%), Apache (39.9%, a difference of 1.2%), Dominican (39.8%, a difference of 1.2%), and Immigrants from Caribbean (39.8%, a difference of 1.3%). Similarly, the demographic groups most similar to Immigrants from West Indies are Haitian (38.6%, a difference of 0.010%), Spanish American (38.6%, a difference of 0.060%), Honduran (38.7%, a difference of 0.25%), Immigrants from Jamaica (38.8%, a difference of 0.57%), and Yaqui (38.8%, a difference of 0.62%).
| Demographics | Rating | Rank | Births to Unmarried Women |
| Spanish Americans | 0.0 /100 | #299 | Tragic 38.6% |
| Immigrants | West Indies | 0.0 /100 | #300 | Tragic 38.6% |
| Haitians | 0.0 /100 | #301 | Tragic 38.6% |
| Hondurans | 0.0 /100 | #302 | Tragic 38.7% |
| Immigrants | Jamaica | 0.0 /100 | #303 | Tragic 38.8% |
| Yaqui | 0.0 /100 | #304 | Tragic 38.8% |
| Immigrants | Haiti | 0.0 /100 | #305 | Tragic 38.9% |
| Central American Indians | 0.0 /100 | #306 | Tragic 39.0% |
| Immigrants | Honduras | 0.0 /100 | #307 | Tragic 39.3% |
| Aleuts | 0.0 /100 | #308 | Tragic 39.3% |
| Cubans | 0.0 /100 | #309 | Tragic 39.4% |
| Immigrants | Dominica | 0.0 /100 | #310 | Tragic 39.5% |
| Immigrants | Azores | 0.0 /100 | #311 | Tragic 39.6% |
| U.S. Virgin Islanders | 0.0 /100 | #312 | Tragic 39.6% |
| Africans | 0.0 /100 | #313 | Tragic 39.7% |
| Immigrants | Caribbean | 0.0 /100 | #314 | Tragic 39.8% |
| Dominicans | 0.0 /100 | #315 | Tragic 39.8% |
| Apache | 0.0 /100 | #316 | Tragic 39.9% |
| Immigrants | Dominican Republic | 0.0 /100 | #317 | Tragic 40.1% |
| Immigrants | Bahamas | 0.0 /100 | #318 | Tragic 40.1% |
| Yakama | 0.0 /100 | #319 | Tragic 40.3% |