Immigrants from Zaire vs Pueblo Births to Unmarried Women
COMPARE
Immigrants from Zaire
Pueblo
Births to Unmarried Women
Births to Unmarried Women Comparison
Immigrants from Zaire
Pueblo
34.5%
BIRTHS TO UNMARRIED WOMEN
2.3/ 100
METRIC RATING
234th/ 347
METRIC RANK
53.7%
BIRTHS TO UNMARRIED WOMEN
0.0/ 100
METRIC RATING
346th/ 347
METRIC RANK
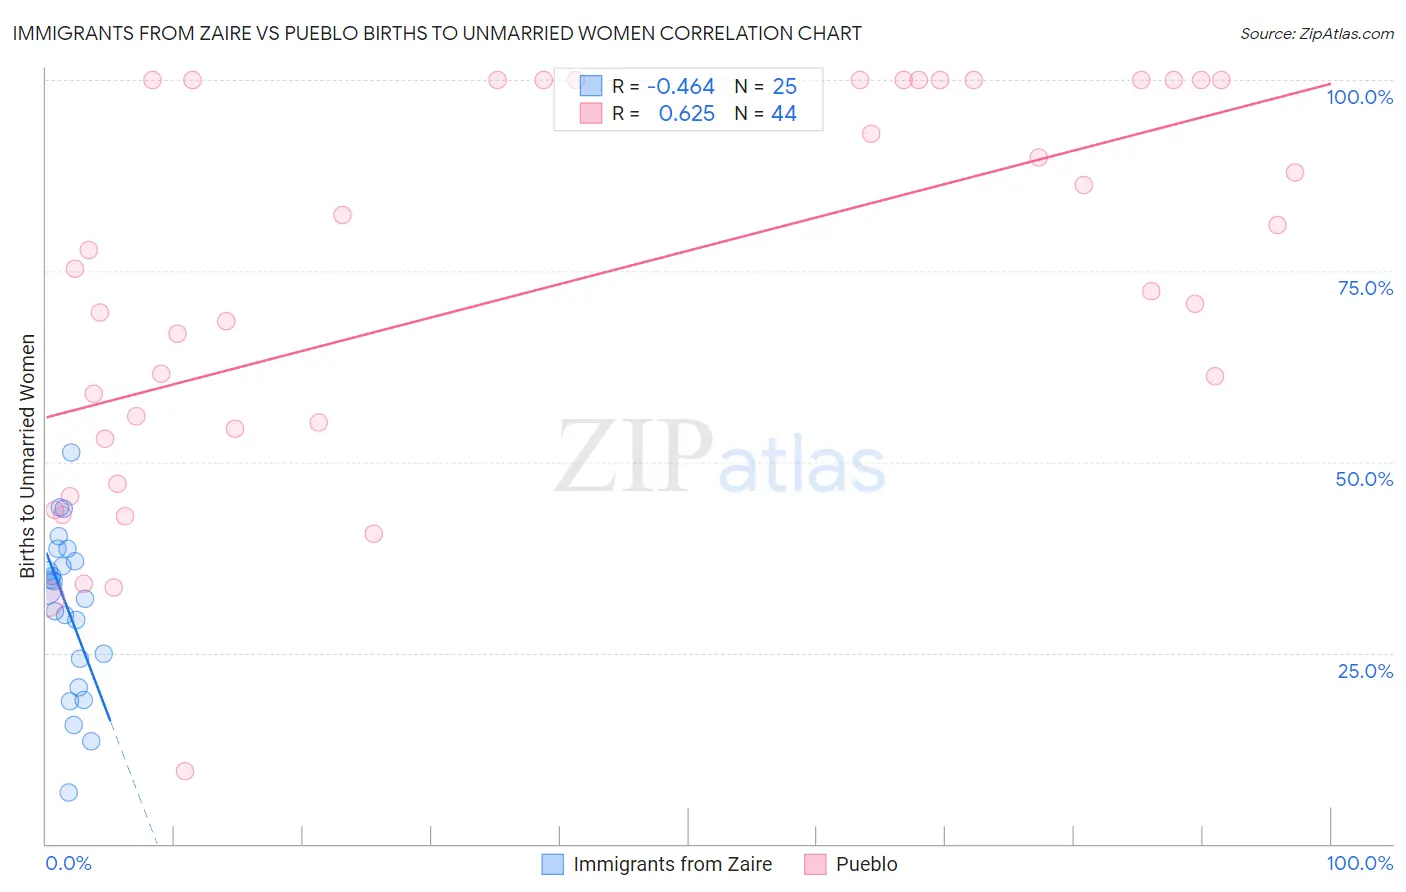
Immigrants from Zaire vs Pueblo Births to Unmarried Women Correlation Chart
The statistical analysis conducted on geographies consisting of 105,430,695 people shows a moderate negative correlation between the proportion of Immigrants from Zaire and percentage of births to unmarried women in the United States with a correlation coefficient (R) of -0.464 and weighted average of 34.5%. Similarly, the statistical analysis conducted on geographies consisting of 117,205,072 people shows a significant positive correlation between the proportion of Pueblo and percentage of births to unmarried women in the United States with a correlation coefficient (R) of 0.625 and weighted average of 53.7%, a difference of 55.6%.
Births to Unmarried Women Correlation Summary
| Measurement | Immigrants from Zaire | Pueblo |
| Minimum | 6.8% | 9.5% |
| Maximum | 51.2% | 100.0% |
| Range | 44.5% | 90.5% |
| Mean | 30.7% | 72.6% |
| Median | 33.4% | 73.8% |
| Interquartile 25% (IQ1) | 22.4% | 53.7% |
| Interquartile 75% (IQ3) | 37.8% | 100.0% |
| Interquartile Range (IQR) | 15.4% | 46.3% |
| Standard Deviation (Sample) | 10.6% | 25.2% |
| Standard Deviation (Population) | 10.4% | 24.9% |
Similar Demographics by Births to Unmarried Women
Demographics Similar to Immigrants from Zaire by Births to Unmarried Women
In terms of births to unmarried women, the demographic groups most similar to Immigrants from Zaire are Immigrants from Ghana (34.5%, a difference of 0.070%), Bangladeshi (34.4%, a difference of 0.24%), French Canadian (34.4%, a difference of 0.26%), Native Hawaiian (34.3%, a difference of 0.56%), and Ghanaian (34.3%, a difference of 0.70%).
| Demographics | Rating | Rank | Births to Unmarried Women |
| Immigrants | Panama | 3.3 /100 | #227 | Tragic 34.2% |
| Panamanians | 3.3 /100 | #228 | Tragic 34.2% |
| Immigrants | Sierra Leone | 3.1 /100 | #229 | Tragic 34.2% |
| Ghanaians | 3.1 /100 | #230 | Tragic 34.3% |
| Native Hawaiians | 2.9 /100 | #231 | Tragic 34.3% |
| French Canadians | 2.5 /100 | #232 | Tragic 34.4% |
| Bangladeshis | 2.5 /100 | #233 | Tragic 34.4% |
| Immigrants | Zaire | 2.3 /100 | #234 | Tragic 34.5% |
| Immigrants | Ghana | 2.2 /100 | #235 | Tragic 34.5% |
| Immigrants | Cameroon | 1.6 /100 | #236 | Tragic 34.7% |
| Marshallese | 1.6 /100 | #237 | Tragic 34.8% |
| Immigrants | Cambodia | 1.6 /100 | #238 | Tragic 34.8% |
| Sierra Leoneans | 1.4 /100 | #239 | Tragic 34.9% |
| Immigrants | Middle Africa | 1.2 /100 | #240 | Tragic 34.9% |
| Immigrants | Guyana | 1.2 /100 | #241 | Tragic 35.0% |
Demographics Similar to Pueblo by Births to Unmarried Women
In terms of births to unmarried women, the demographic groups most similar to Pueblo are Inupiat (52.1%, a difference of 3.0%), Navajo (51.5%, a difference of 4.2%), Pima (51.5%, a difference of 4.2%), Menominee (51.1%, a difference of 5.0%), and Yup'ik (56.4%, a difference of 5.2%).
| Demographics | Rating | Rank | Births to Unmarried Women |
| Blacks/African Americans | 0.0 /100 | #333 | Tragic 44.3% |
| Yuman | 0.0 /100 | #334 | Tragic 44.4% |
| Colville | 0.0 /100 | #335 | Tragic 45.3% |
| Puerto Ricans | 0.0 /100 | #336 | Tragic 45.7% |
| Houma | 0.0 /100 | #337 | Tragic 46.6% |
| Arapaho | 0.0 /100 | #338 | Tragic 47.1% |
| Lumbee | 0.0 /100 | #339 | Tragic 48.2% |
| Tohono O'odham | 0.0 /100 | #340 | Tragic 49.8% |
| Hopi | 0.0 /100 | #341 | Tragic 50.8% |
| Menominee | 0.0 /100 | #342 | Tragic 51.1% |
| Pima | 0.0 /100 | #343 | Tragic 51.5% |
| Navajo | 0.0 /100 | #344 | Tragic 51.5% |
| Inupiat | 0.0 /100 | #345 | Tragic 52.1% |
| Pueblo | 0.0 /100 | #346 | Tragic 53.7% |
| Yup'ik | 0.0 /100 | #347 | Tragic 56.4% |