Yakama vs Immigrants from South Africa Average Family Size
COMPARE
Yakama
Immigrants from South Africa
Average Family Size
Average Family Size Comparison
Yakama
Immigrants from South Africa
3.45
AVERAGE FAMILY SIZE
100.0/ 100
METRIC RATING
25th/ 347
METRIC RANK
3.16
AVERAGE FAMILY SIZE
0.9/ 100
METRIC RATING
265th/ 347
METRIC RANK
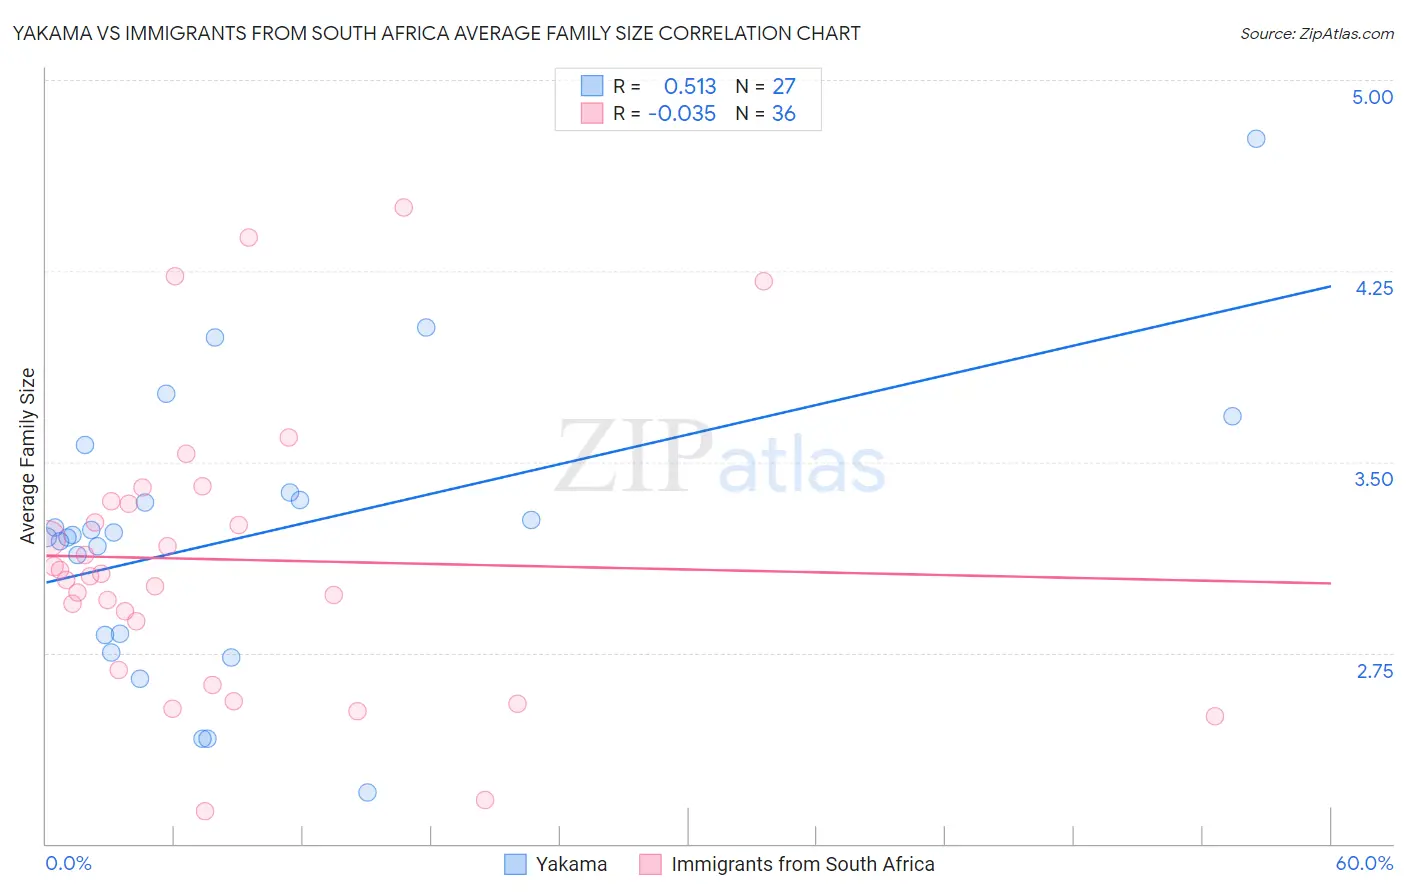
Yakama vs Immigrants from South Africa Average Family Size Correlation Chart
The statistical analysis conducted on geographies consisting of 19,917,879 people shows a substantial positive correlation between the proportion of Yakama and average family size in the United States with a correlation coefficient (R) of 0.513 and weighted average of 3.45. Similarly, the statistical analysis conducted on geographies consisting of 233,270,414 people shows no correlation between the proportion of Immigrants from South Africa and average family size in the United States with a correlation coefficient (R) of -0.035 and weighted average of 3.16, a difference of 9.1%.
Average Family Size Correlation Summary
| Measurement | Yakama | Immigrants from South Africa |
| Minimum | 2.20 | 2.13 |
| Maximum | 4.77 | 4.50 |
| Range | 2.57 | 2.37 |
| Mean | 3.21 | 3.12 |
| Median | 3.21 | 3.06 |
| Interquartile 25% (IQ1) | 2.82 | 2.78 |
| Interquartile 75% (IQ3) | 3.38 | 3.34 |
| Interquartile Range (IQR) | 0.56 | 0.56 |
| Standard Deviation (Sample) | 0.55 | 0.56 |
| Standard Deviation (Population) | 0.54 | 0.55 |
Similar Demographics by Average Family Size
Demographics Similar to Yakama by Average Family Size
In terms of average family size, the demographic groups most similar to Yakama are Native/Alaskan (3.45, a difference of 0.11%), Immigrants from Fiji (3.45, a difference of 0.23%), Native Hawaiian (3.43, a difference of 0.51%), Apache (3.46, a difference of 0.52%), and Mexican American Indian (3.43, a difference of 0.52%).
| Demographics | Rating | Rank | Average Family Size |
| Salvadorans | 100.0 /100 | #18 | Exceptional 3.48 |
| Mexicans | 100.0 /100 | #19 | Exceptional 3.48 |
| Cheyenne | 100.0 /100 | #20 | Exceptional 3.47 |
| Yuman | 100.0 /100 | #21 | Exceptional 3.47 |
| Apache | 100.0 /100 | #22 | Exceptional 3.46 |
| Immigrants | Fiji | 100.0 /100 | #23 | Exceptional 3.45 |
| Natives/Alaskans | 100.0 /100 | #24 | Exceptional 3.45 |
| Yakama | 100.0 /100 | #25 | Exceptional 3.45 |
| Native Hawaiians | 100.0 /100 | #26 | Exceptional 3.43 |
| Mexican American Indians | 100.0 /100 | #27 | Exceptional 3.43 |
| Immigrants | Latin America | 100.0 /100 | #28 | Exceptional 3.42 |
| Nepalese | 100.0 /100 | #29 | Exceptional 3.42 |
| Samoans | 100.0 /100 | #30 | Exceptional 3.42 |
| Central Americans | 100.0 /100 | #31 | Exceptional 3.41 |
| Immigrants | Guatemala | 100.0 /100 | #32 | Exceptional 3.41 |
Demographics Similar to Immigrants from South Africa by Average Family Size
In terms of average family size, the demographic groups most similar to Immigrants from South Africa are Immigrants from Greece (3.16, a difference of 0.010%), Iroquois (3.16, a difference of 0.030%), American (3.16, a difference of 0.050%), Immigrants from Bulgaria (3.16, a difference of 0.070%), and Maltese (3.16, a difference of 0.080%).
| Demographics | Rating | Rank | Average Family Size |
| Turks | 1.3 /100 | #258 | Tragic 3.16 |
| Potawatomi | 1.3 /100 | #259 | Tragic 3.16 |
| Immigrants | Albania | 1.3 /100 | #260 | Tragic 3.16 |
| Immigrants | North Macedonia | 1.3 /100 | #261 | Tragic 3.16 |
| Immigrants | Russia | 1.3 /100 | #262 | Tragic 3.16 |
| Immigrants | Bulgaria | 1.0 /100 | #263 | Tragic 3.16 |
| Americans | 1.0 /100 | #264 | Tragic 3.16 |
| Immigrants | South Africa | 0.9 /100 | #265 | Tragic 3.16 |
| Immigrants | Greece | 0.9 /100 | #266 | Tragic 3.16 |
| Iroquois | 0.8 /100 | #267 | Tragic 3.16 |
| Maltese | 0.8 /100 | #268 | Tragic 3.16 |
| Immigrants | Singapore | 0.7 /100 | #269 | Tragic 3.16 |
| Tlingit-Haida | 0.7 /100 | #270 | Tragic 3.16 |
| Immigrants | Germany | 0.7 /100 | #271 | Tragic 3.15 |
| Immigrants | Lithuania | 0.6 /100 | #272 | Tragic 3.15 |